

Interaction Potentials of Anisotropic Nanocrystals from the Trajectory Sampling of Particle Motion using in Situ Liquid Phase Transmission Electron Microscopy
- PMID: 27162944
- PMCID: PMC4827565
- DOI: 10.1021/acscentsci.5b00001
Interaction Potentials of Anisotropic Nanocrystals from the Trajectory Sampling of Particle Motion using in Situ Liquid Phase Transmission Electron Microscopy
Abstract
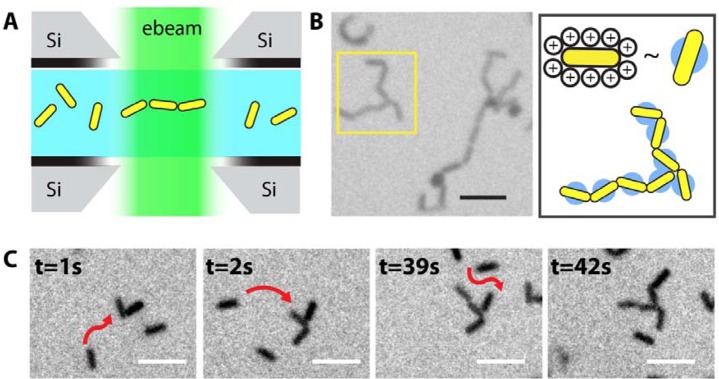
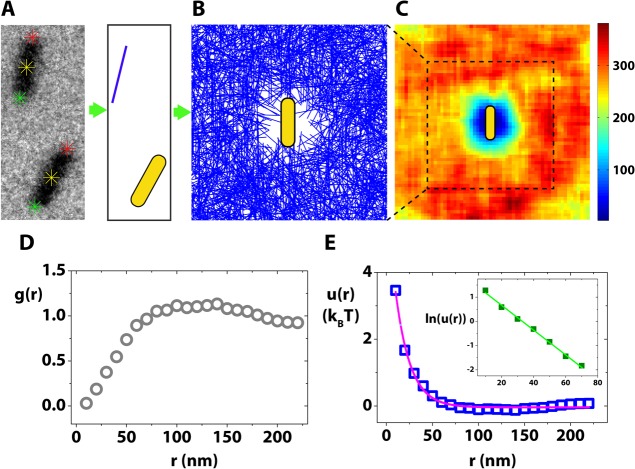
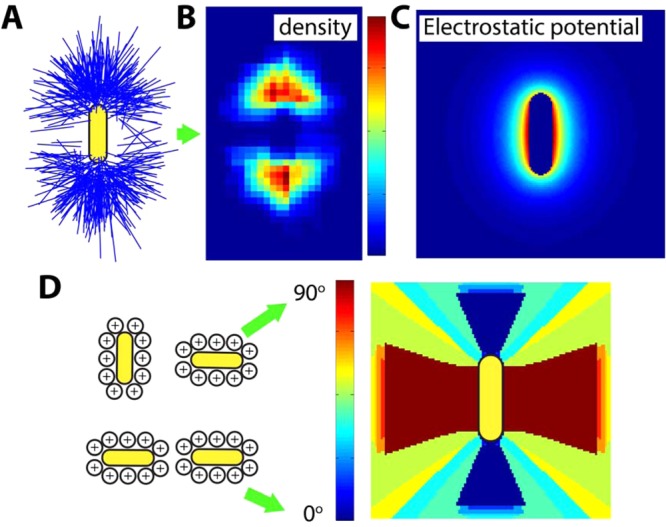
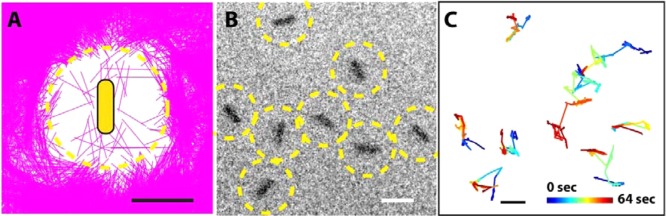
We demonstrate a generalizable strategy to use the relative trajectories of pairs and groups of nanocrystals, and potentially other nanoscale objects, moving in solution which can now be obtained by in situ liquid phase transmission electron microscopy (TEM) to determine the interaction potentials between nanocrystals. Such nanoscale interactions are crucial for collective behaviors and applications of synthetic nanocrystals and natural biomolecules, but have been very challenging to measure in situ at nanometer or sub-nanometer resolution. Here we use liquid phase TEM to extract the mathematical form of interaction potential between nanocrystals from their sampled trajectories. We show the power of this approach to reveal unanticipated features of nanocrystal-nanocrystal interactions by examining the anisotropic interaction potential between charged rod-shaped Au nanocrystals (Au nanorods); these Au nanorods assemble, in a tip-to-tip fashion in the liquid phase, in contrast to the well-known side-by-side arrangements commonly observed for drying-mediated assembly. These observations can be explained by a long-range and highly anisotropic electrostatic repulsion that leads to the tip-selective attachment. As a result, Au nanorods stay unassembled at a lower ionic strength, as the electrostatic repulsion is even longer-ranged. Our study not only provides a mechanistic understanding of the process by which metallic nanocrystals assemble but also demonstrates a method that can potentially quantify and elucidate a broad range of nanoscale interactions relevant to nanotechnology and biophysics.
Figures
References
-
- Knowles T. P. J.; Vendruscolo M.; Dobson C. M. The amyloid state and its association with protein misfolding diseases. Nat. Rev. Mol. Cell Biol. 2014, 15, 384–396. - PubMed
-
- Adamcik J.; Jung J.-M.; Flakowski J.; De Los Rios P.; Dietler G.; Mezzenga R. Understanding amyloid aggregation by statistical analysis of atomic force microscopy images. Nat. Nanotechnol. 2010, 5, 423–428. - PubMed
-
- Prasad B. V. V; Hardy M. E.; Dokland T.; Bella J.; Rossmann M. G.; Estes M. K. X-ray Crystallographic Structure of the Norwalk Virus Capsid. Science 1999, 286, 287–290. - PubMed
-
- Berg B. v. d.; Clemons W. M.; Collinson I.; Modis Y.; Hartmann E.; Harrison S. C.; Rapoport T. A. X-ray structure of a protein-conducting channel. Nature 2004, 427, 36–44. - PubMed
-
- Whitesides G. M.; Grzybowski B. Self-assembly at all scales. Science 2002, 295, 2418–2421. - PubMed
LinkOut - more resources
Full Text Sources
Other Literature Sources
Research Materials