

Influence of the Microenvironment in the Transcriptome of Leishmania infantum Promastigotes: Sand Fly versus Culture
- PMID: 27163123
- PMCID: PMC4862625
- DOI: 10.1371/journal.pntd.0004693
Influence of the Microenvironment in the Transcriptome of Leishmania infantum Promastigotes: Sand Fly versus Culture
Abstract
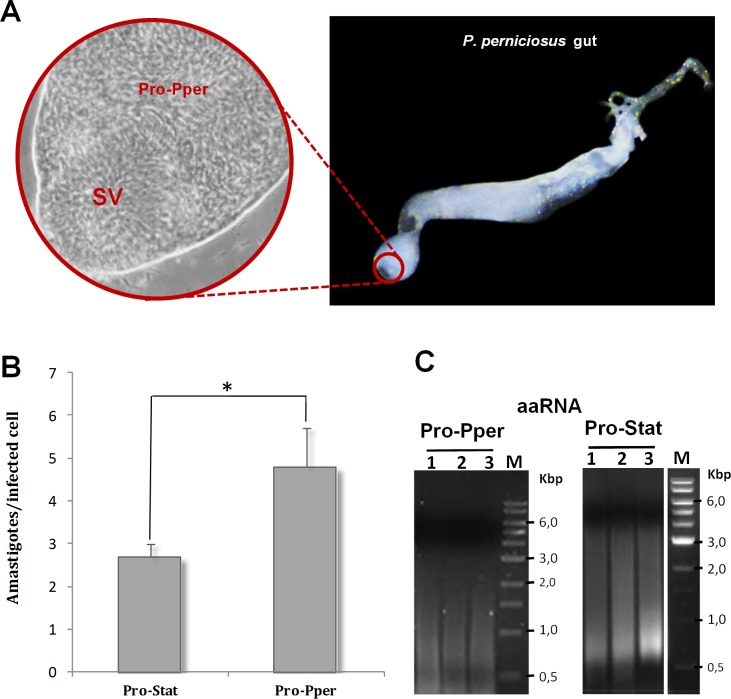
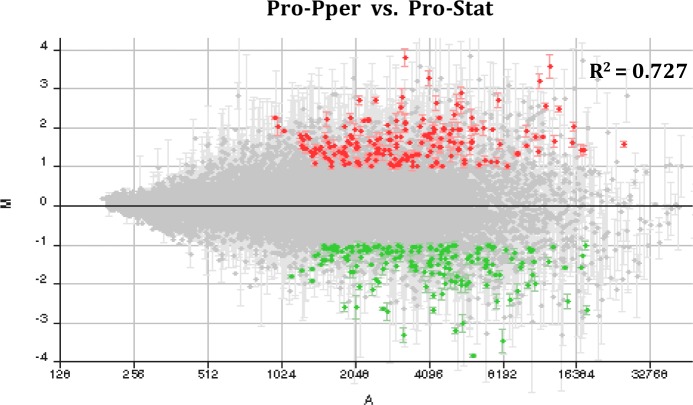
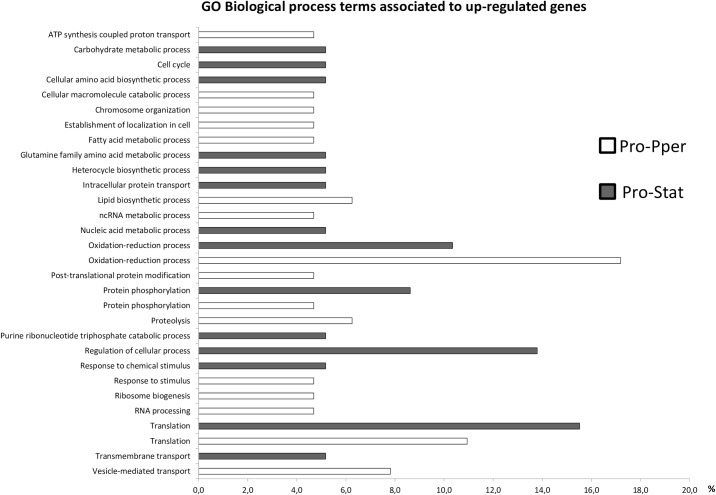
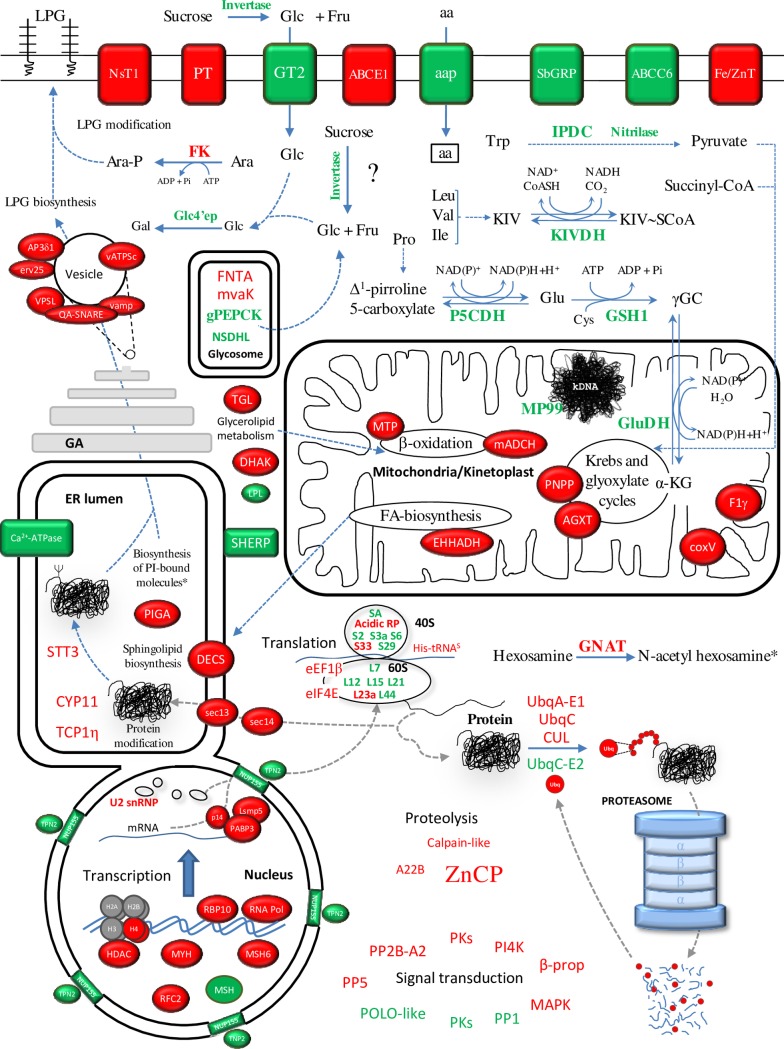
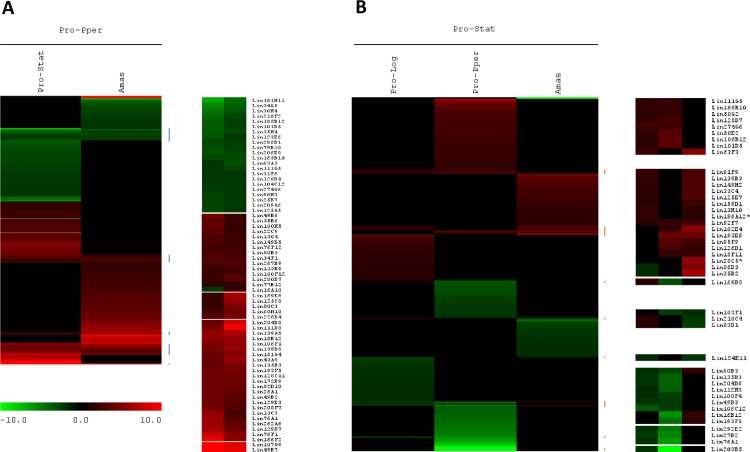
Zoonotic visceral leishmaniasis is a vector-borne disease caused by Leishmania infantum in the Mediterranean Basin, where domestic dogs and wild canids are the main reservoirs. The promastigote stage replicates and develops within the gut of blood-sucking phlebotomine sand flies. Mature promastigotes are injected in the dermis of the mammalian host and differentiate into the amastigote stage within parasitophorous vacuoles of phagocytic cells. The major vector of L. infantum in Spain is Phlebotomus perniciosus. Promastigotes are routinely axenized and cultured to mimic in vitro the conditions inside the insect gut, which allows for most molecular, cellular, immunological and therapeutical studies otherwise inviable. Culture passages are known to decrease infectivity, which is restored by passage through laboratory animals. The most appropriate source of promastigotes is the gut of the vector host but isolation of the parasite is technically challenging. In fact, this option is not viable unless small samples are sufficient for downstream applications like promastigote cultures and nucleic acid amplification. In this study, in vitro infectivity and differential gene expression have been studied in cultured promastigotes at the stationary phase and in promastigotes isolated from the stomodeal valve of the sand fly P. perniciosus. About 20 ng RNA per sample could be isolated. Each sample contained L. infantum promastigotes from 20 sand flies. RNA was successfully amplified and processed for shotgun genome microarray hybridization analysis. Most differentially regulated genes are involved in regulation of gene expression, intracellular signaling, amino acid metabolism and biosynthesis of surface molecules. Interestingly, meta-analysis by hierarchical clustering supports that up-regulation of 22.4% of the differentially regulated genes is specifically enhanced by the microenvironment (i.e. sand fly gut or culture). The correlation between cultured and naturally developed promastigotes is strong but not very high (Pearson coefficient R2 = 0.727). Therefore, the influence of promastigote culturing should be evaluated case-by-case in experimentation.
Conflict of interest statement
The authors have declared that no competing interests exist.
Figures
Similar articles
-
Functional genomics in sand fly-derived Leishmania promastigotes.PLoS Negl Trop Dis. 2019 May 9;13(5):e0007288. doi: 10.1371/journal.pntd.0007288. eCollection 2019 May. PLoS Negl Trop Dis. 2019. PMID: 31071080 Free PMC article. Review.
-
In vitro infectivity and differential gene expression of Leishmania infantum metacyclic promastigotes: negative selection with peanut agglutinin in culture versus isolation from the stomodeal valve of Phlebotomus perniciosus.BMC Genomics. 2016 May 20;17:375. doi: 10.1186/s12864-016-2672-8. BMC Genomics. 2016. PMID: 27206922 Free PMC article.
-
Stage-specific differential gene expression in Leishmania infantum: from the foregut of Phlebotomus perniciosus to the human phagocyte.BMC Genomics. 2014 Oct 3;15(1):849. doi: 10.1186/1471-2164-15-849. BMC Genomics. 2014. PMID: 25281593 Free PMC article.
-
The vector competence of Phlebotomus perniciosus for Leishmania infantum zymodemes of Tunisia.Parasitol Res. 2018 Aug;117(8):2499-2506. doi: 10.1007/s00436-018-5939-y. Epub 2018 May 26. Parasitol Res. 2018. PMID: 29804194
-
Controlling phlebotomine sand flies to prevent canine Leishmania infantum infection: A case of knowing your enemy.Res Vet Sci. 2018 Dec;121:94-103. doi: 10.1016/j.rvsc.2018.10.008. Epub 2018 Oct 13. Res Vet Sci. 2018. PMID: 30366124 Review.
Cited by
-
Functional genomics in sand fly-derived Leishmania promastigotes.PLoS Negl Trop Dis. 2019 May 9;13(5):e0007288. doi: 10.1371/journal.pntd.0007288. eCollection 2019 May. PLoS Negl Trop Dis. 2019. PMID: 31071080 Free PMC article. Review.
-
Evaluation of expression variations in virulence-related genes of Leishmania major after several culture passages compared with Phlebotomus papatasi isolated promastigotes.PLoS One. 2023 Apr 13;18(4):e0284240. doi: 10.1371/journal.pone.0284240. eCollection 2023. PLoS One. 2023. PMID: 37053214 Free PMC article.
-
Increased Abundance of Proteins Involved in Resistance to Oxidative and Nitrosative Stress at the Last Stages of Growth and Development of Leishmania amazonensis Promastigotes Revealed by Proteome Analysis.PLoS One. 2016 Oct 24;11(10):e0164344. doi: 10.1371/journal.pone.0164344. eCollection 2016. PLoS One. 2016. PMID: 27776144 Free PMC article.
-
Modulation of Aneuploidy in Leishmania donovani during Adaptation to Different In Vitro and In Vivo Environments and Its Impact on Gene Expression.mBio. 2017 May 23;8(3):e00599-17. doi: 10.1128/mBio.00599-17. mBio. 2017. PMID: 28536289 Free PMC article.
-
In vitro infectivity and differential gene expression of Leishmania infantum metacyclic promastigotes: negative selection with peanut agglutinin in culture versus isolation from the stomodeal valve of Phlebotomus perniciosus.BMC Genomics. 2016 May 20;17:375. doi: 10.1186/s12864-016-2672-8. BMC Genomics. 2016. PMID: 27206922 Free PMC article.
References
-
- Desjeux P (1996) Leishmaniasis. Public health aspects and control. Clin Dermatol 14: 417–423. - PubMed
-
- WHO (2010) Report of a Meeting of the WHO Expert Committee on the Control of Leishmaniases. Geneva.
-
- Pasquau F, Ena J, Sanchez R, Cuadrado JM, Amador C, et al. (2005) Leishmaniasis as an opportunistic infection in HIV-infected patients: determinants of relapse and mortality in a collaborative study of 228 episodes in a Mediterreanean region. Eur J Clin Microbiol Infect Dis 24: 411–418. - PubMed
-
- Cruz I, Nieto J, Moreno J, Canavate C, Desjeux P, et al. (2006) Leishmania/HIV co-infections in the second decade. Indian J Med Res 123: 357–388. - PubMed
-
- Arce A, Estirado A, Ordobas M, Sevilla S, Garcia N, et al. (2013) Re-emergence of leishmaniasis in Spain: community outbreak in Madrid, Spain, 2009 to 2012. Euro Surveill 18: 20546 - PubMed
Publication types
MeSH terms
LinkOut - more resources
Full Text Sources
Other Literature Sources
