. 2016 May 10:7:11463.
doi: 10.1038/ncomms11463.

Generation of stem cell-derived β-cells from patients with type 1 diabetes

Affiliations

Generation of stem cell-derived β-cells from patients with type 1 diabetes

Jeffrey R Millman et al. Nat Commun. .

Erratum in

Abstract

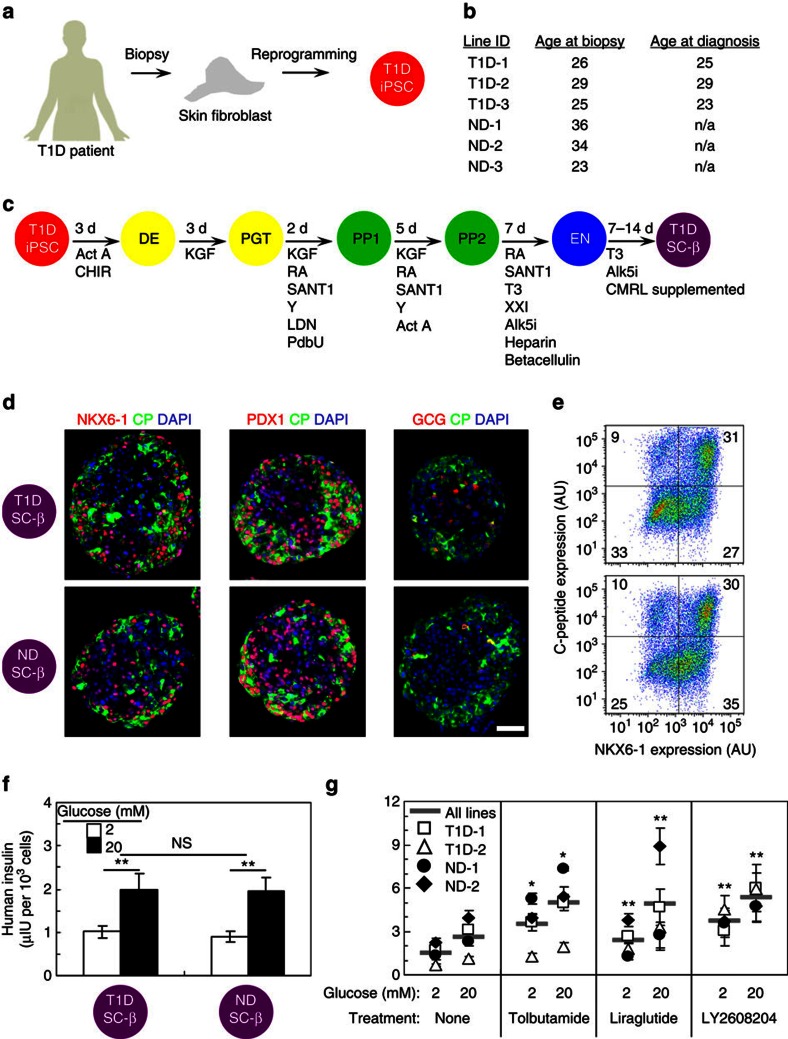
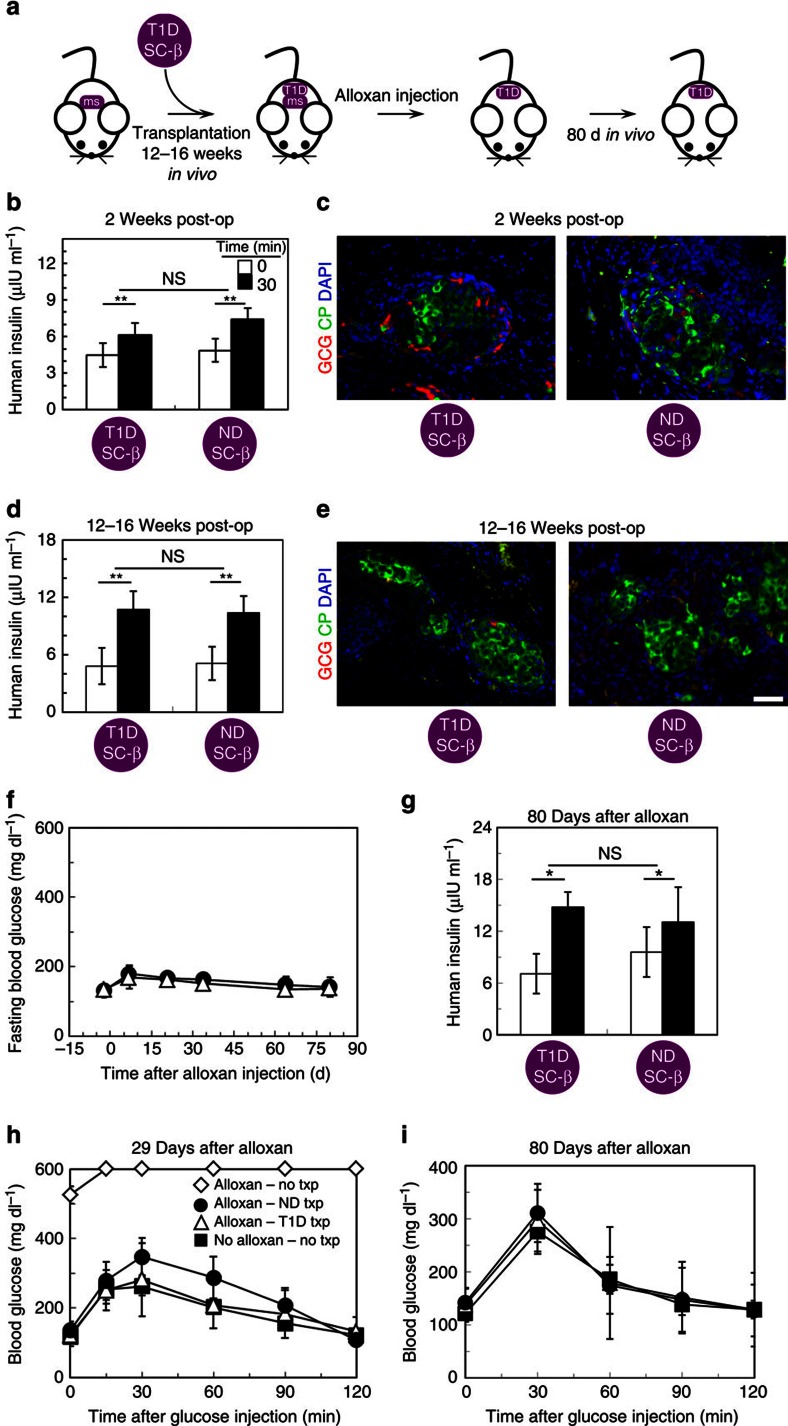
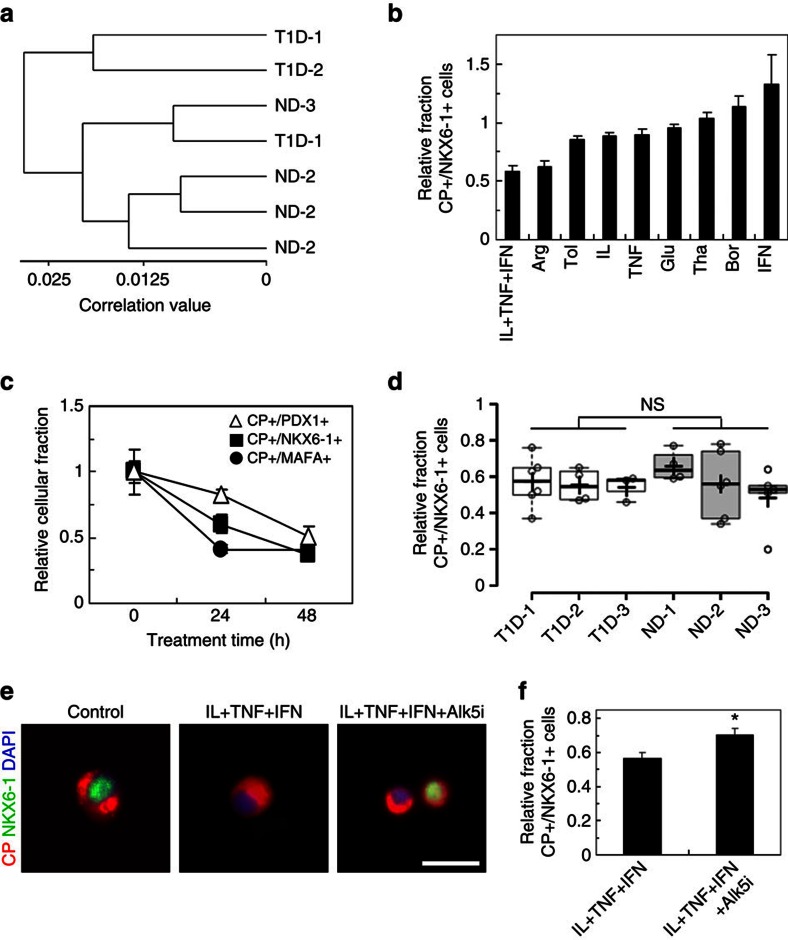
We recently reported the scalable in vitro production of functional stem cell-derived β-cells (SC-β cells). Here we extend this approach to generate the first SC-β cells from type 1 diabetic patients (T1D). β-cells are destroyed during T1D disease progression, making it difficult to extensively study them in the past. These T1D SC-β cells express β-cell markers, respond to glucose both in vitro and in vivo, prevent alloxan-induced diabetes in mice and respond to anti-diabetic drugs. Furthermore, we use an in vitro disease model to demonstrate the cells respond to different forms of β-cell stress. Using these assays, we find no major differences in T1D SC-β cells compared with SC-β cells derived from non-diabetic patients. These results show that T1D SC-β cells could potentially be used for the treatment of diabetes, drug screening and the study of β-cell biology.


Conflict of interest statement

J.R.M., M.G., F.W.P. and D.A.M. are inventors on patent applications for content described in this manuscript. F.W.P. is an employee at Semma Therapeutics.

Figures

Figure 1
Figure 1. T1D SC-β cells express β-cell markers and secrete insulin in response to high glucose and anti-diabetic drug treatment in vitro.
(a) Schematic summarizing derivation of hiPSC from T1D patients. (b) Table of cell lines used in study, showing donor age at the time of skin biopsy procurement and age of diagnosis of T1D, if applicable. (c) Schematic summarizing differentiation protocol used to produce SC-β cells. (d) Representative immunostaining of T1D and ND SC-β cells stained for NKX6-1, PDX1, glucagon (GCG; red) with C-peptide (CP; green) and 4,6-diamidino-2-phenylindole (DAPI) (blue). Scale bar, 100 μm. (e) Representative flow cytometry plot of dispersed clusters stained for C-peptide and NKX6-1. AU, arbitrary units. (f) Average ELISA measurements of secreted human insulin at 2 and 20 mM glucose. n=9 and 9 SC-β cell batches, each consisting of 3 T1D donors and 3 ND donor. **P<0.01 comparing 20 and 2 mM glucose treatments (two-sided paired t-test). (g) ELISA measurements of secreted human insulin at 2 and 20 mM glucose for a subset of cell lines treated with the anti-diabetic drugs Tolbutamide (sulfonylurea), Liraglutide (GLP-1 R agonist) and LY2608204 (GCK activator). n=4 measurements for each line. *P<0.05 and **P<0.01 comparing drug treatment with no treatment at the same glucose concentration (two-sided unpaired t-test). Data shown as mean±s.e.m. Samples taken after 10–17 days in Stage 6. Act A, activin A; Alk5i, Alk5 receptor inhibitor II; CHIR, CHIR9901; KGF, keratinocyte growth factor; LDN, LDN193189; PdbU, phorbol 12,13-dibutyrate; RA, retinoic acid; T3, triiodothyronine; Y, Y27632.
Figure 2
Figure 2. T1D SC-β cells function rapidly and persist several months in vivo after transplantation.
(a) Schematic summarizing in vivo transplantation experiments. ms, endogenous mouse β cells. T1D, T1D SC-β cells. (b) Average ELISA measurements of serum human insulin before (0 min) and 30 min after a glucose injection for mice that received T1D and ND SC-β cells 2 week prior. n=32 and 48 for T1D and ND SC-β cells, respectively. (c) Representative immunostaining of grafts 2 weeks after transplantation stained with glucagon (GCG; red), C-peptide (green) and 4,6-diamidino-2-phenylindole (DAPI) (blue). (d) Average ELISA measurements of serum human insulin before (0 min) and 30 min after a glucose injection for mice that received T1D and ND SC-β cells 12–16 weeks prior. n=15 and 18 for T1D and ND SC-β cells, respectively. (e) Representative immunostaining of grafts 12–16 weeks after transplantation. (f) Fasting blood glucose measurements for a subset of mice that received an alloxan injection to destroy endogenouse mouse β cells. Mice that were transplanted with ND SC-β cells (closed circle; n=4) and with T1D SC-β cells (open triangle; n=4) are shown. (g) Average ELISA measurements of serum human insulin before (0 min) and 30 min after a glucose injection for mice that were injected with alloxan 80 days prior. n=4 and 4 for T1D and ND SC-β cells, respectively. (h) Temporal blood glucose measurements after a glucose injection 29 days after alloxan treatment. Shown are mice that had not received a transplantation (open diamond; n=2), were transplanted with ND SC-β cells (closed circle; n=4), were transplanted with T1D SC-β cells (open triangle; n=4), or did not receive alloxan treatment and did not receive a transplantation (closed square; n=5) are shown. (i) Temporal blood glucose measurements after a glucose injection 80 days after alloxan treatment. Mice that were transplanted with ND SC-β cells (closed circle; n=4), were transplanted with T1D SC-β cells (open triangle; n=4), or did not receive alloxan treatment and did not receive a transplantation (closed square; n=4) are shown. Mice were transplanted with cells 10–17 days in Stage 6. Scale bar, 100 μm. *P<0.05 and **P<0.01 (two-sided paired t-test). Data shown as mean±s.e.m.
Figure 3
Figure 3. T1D and ND SC-β cells have similar gene expression and response to cytokine stress.
(a) Hierarchical clustering based on global gene expression measured by microarray of a subset of T1D and ND SC-β cell lines sorted for INS and NKX6-1. Individual replicates shown. (b) The average relative fraction of T1D and ND SC-β cells immunostained for C-peptide (CP) and NKX6-1 treated 24 h with the indicated stressor normalized by untreated cells. n=3 T1D and 4 ND SC-β cells batches (7 batches total). (c) The average relative fraction of cells immunostained for C-peptide and PDX1, NKX6-1 or MAFA treated up to 48 h with interleukin (IL)-1β, tumour necrosis factor (TNF)-α and interferon (IFN)-γ n=3 T1D and 4 ND SC-β cells batches (7 batches total). (d) Box and whiskers plot comparing of the relative fraction of C-peptide+/NKX6-1+ cells for T1D-1 (n=6), T1D-2 (n=4), T1D-3 (n=3), ND-1 (n=4), ND-2 (n=6) and ND-3 (n=5) after 24 h treatment with IL-1β, TNF-α and IFN-γ (28 batches total). The cross indicates the mean, the line the median and each circle is one biological replicate. (e) Representative images of immunostained cells not treated, treated with IL-1β, TNF-α and IFN-γ, or treated with IL-1β, TNF-α, IFN-γ and Alk5i for 24 h. Scale bar, 20 μm. (f) Average relative fraction of C-peptide+/NKX6-1+ cells treated with IL-1β, TNF-α and IFN-γ either without (left) or with (right) Alk5i for 24 h. n=10 T1D and 7 ND SC-β cells batches (17 batches total). Quantification of immunostained cells in this figure was performed with Cellomics ArrayScanVTI. *P<0.05 (two-sided paired t-test). Experiments were performed on and samples taken from cells after 10–17 days in Stage 6. Arg, arginine; Bor, bortezomib; Glu, glucose; IFN, interferon-γ; IL, interleukin-1β; Tha, Thapsagargin; TNF, tumour necrosis factor-α; Tol, tolbutamide. Data shown as mean±s.e.m.

References

    1. Bakay M., Pandey R. & Hakonarson H. Genes involved in type 1 diabetes: an update. Genes (Basel) 4, 499–521 (2013). - PMC - PubMed
    1. Bergholdt R. et al.. Identification of novel type 1 diabetes candidate genes by integrating genome-wide association data, protein-protein interactions, and human pancreatic islet gene expression. Diabetes 61, 954–962 (2012). - PMC - PubMed
    1. Santin I. & Eizirik D. L. Candidate genes for type 1 diabetes modulate pancreatic islet inflammation and beta-cell apoptosis. Diabetes Obes. Metab. 15, 71–81 (2013). - PubMed
    1. Tersey S. A. et al.. Islet beta-cell endoplasmic reticulum stress precedes the onset of type 1 diabetes in the nonobese diabetic mouse model. Diabetes 61, 818–827 (2012). - PMC - PubMed
    1. Dunne J. L., Overbergh L., Purcell A. W. & Mathieu C. Posttranslational modifications of proteins in type 1 diabetes: the next step in finding the cure? Diabetes 61, 1907–1914 (2012). - PMC - PubMed

Publication types

MeSH terms