. 2016 May 10;6(5):e805.
doi: 10.1038/tp.2016.78.

Differential expression of transcriptional regulatory units in the prefrontal cortex of patients with bipolar disorder: potential role of early growth response gene 3

Affiliations

Differential expression of transcriptional regulatory units in the prefrontal cortex of patients with bipolar disorder: potential role of early growth response gene 3

B Pfaffenseller et al. Transl Psychiatry. .

Abstract

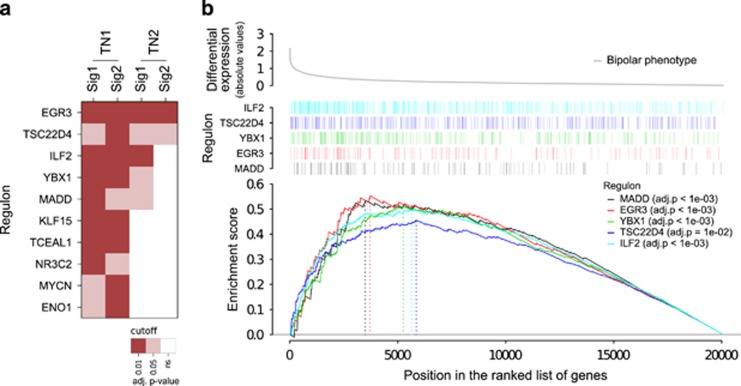
Bipolar disorder (BD) is a severe mental illness with a strong genetic component. Despite its high degree of heritability, current genetic studies have failed to reveal individual loci of large effect size. In lieu of focusing on individual genes, we investigated regulatory units (regulons) in BD to identify candidate transcription factors (TFs) that regulate large groups of differentially expressed genes. Network-based approaches should elucidate the molecular pathways governing the pathophysiology of BD and reveal targets for potential therapeutic intervention. The data from a large-scale microarray study was used to reconstruct the transcriptional associations in the human prefrontal cortex, and results from two independent microarray data sets to obtain BD gene signatures. The regulatory network was derived by mapping the significant interactions between known TFs and all potential targets. Five regulons were identified in both transcriptional network models: early growth response 3 (EGR3), TSC22 domain family, member 4 (TSC22D4), interleukin enhancer-binding factor 2 (ILF2), Y-box binding protein 1 (YBX1) and MAP-kinase-activating death domain (MADD). With a high stringency threshold, the consensus across tests was achieved only for the EGR3 regulon. We identified EGR3 in the prefrontal cortex as a potential key target, robustly repressed in both BD signatures. Considering that EGR3 translates environmental stimuli into long-term changes in the brain, disruption in biological pathways involving EGR3 may induce an impaired response to stress and influence on risk for psychiatric disorders, particularly BD.


Figures

Figure 1
Figure 1
Master regulator (MR) analysis flowchart. (a) Data source used to reconstruct the transcriptional regulatory units in normal human prefrontal cortex. A large-scale microarray study (GSE30272) describing an extensive series of brain tissue from fetal development through aging was used to compute the transcription factor-centric regulatory networks (regulons). The transcriptional network TN1 represents the totality of the 269-microarray samples in the study, whereas the TN2 derives from a subsample with adult human prefrontal cortex only. The analysis pipeline, resampling procedures and methods used to reconstruct the transcriptional networks are further detailed in the Supplementary Figure 1. (b) Flowchart summarizing the microarray data used to obtain two independent bipolar disorder gene expression signatures (bipolar phenotypes). Signature 1 (Sig1; GSE12679) is derived from laser-capture microdissected human neurons isolated from postmortem dorsolateral prefrontal cortex, whereas signature 2 (Sig2; GSE5388) is derived from human postmortem brain tissue from adult subjects. (c) The enrichment analysis aims to identify transcriptional regulatory units associated with the gene expression signatures.
Figure 2
Figure 2
A systems model of the human prefrontal transcriptional network. (a) Association map showing the degree of similarity among regulons in the transcriptional network TN1. The node size represents the number of transcription factor (TF)–targets in the relevance network, whereas edge width corresponds to the overlap between regulons assessed by the Jaccard coefficient (JC). Unconnected regulons are not shown. (b) Enrichment analysis using gene expression signature 1 (Sig1) showing the distribution of the bipolar phenotype onto the association map (adjusted P-value <0.05 are shown in red-color scale).
Figure 3
Figure 3
Consensus master regulators enriched for the bipolar disorder signatures. (a) Gene set enrichment statistics showing the regulatory units consistently enriched for the expression signatures Sig1 and Sig2 on the transcriptional network TN1, together with the results obtained for the same regulons on TN2. (b) Gene set enrichment plots showing the distribution of the top-five master regulators (that is, the consensus regulatory units) across the ranked bipolar phenotype represented by the absolute differential expression values (absolute logFC) derived from Sig1. The enrichment score is obtained based on the distribution of the hits: the x axis indicates the position of all genes ranked by the phenotype, and the hits indicate the position of each gene of a given regulon (see methods for additional description on the GSEA statistics). ns, not significant.
Figure 4
Figure 4
Regulatory units associated with the bipolar disorder phenotype. (a) The regulatory network shows the transcription factor (TF)–target interactions of the five master regulators, each one comprising one TF (square nodes) and all inferred targets (round nodes). The mode of action represented in red/blue colors corresponds to the correlation pattern observed between a given transcription factor and its targets, assessed by the Pearson's correlation on TN1. (b) Two-tailed gene set enrichment analysis. The enrichment plots show the distribution of the genes in each regulon across the ranked phenotype derived from Sig1. Regulons are split in positive (red) and negative (blue) targets, whereas the phenotype is ranked from the highest (+) to the lowest (−) differential expression values (logFC), that is, from the most increased to the most decreased gene expression values.

References

    1. Kieseppa T, Partonen T, Haukka J, Kaprio J, Lönnqvist J. High concordance of bipolar I disorder in a nationwide sample of twins. Am J Psychiatry 2004; 161: 1814–1821. - PubMed
    1. Craddock N, Sklar P. Genetics of bipolar disorder. Lancet 2013; 381: 1654–1662. - PubMed
    1. International Schizophrenia Consortium Purcell SM Wray NR Stone JL Visscher PM O'Donovan MC et al. Common polygenic variation contributes to risk of schizophrenia and bipolar disorder. Nature 2009; 460: 748–752. - PMC - PubMed
    1. Lee SH, Wray NR, Goddard ME, Visscher PM. Estimating missing heritability for disease from genome-wide association studies. Am J Hum Genet 2011; 88: 294–305. - PMC - PubMed
    1. Gershon ES, Alliey-Rodriguez N, Liu C. After GWAS: searching for genetic risk for schizophrenia and bipolar disorder. Am J Psychiatry 2011; 168: 253–256. - PMC - PubMed

Publication types

MeSH terms