. 2016 May 10;6(5):e806.
doi: 10.1038/tp.2016.66.

Genetic deletion of fibroblast growth factor 14 recapitulates phenotypic alterations underlying cognitive impairment associated with schizophrenia

Affiliations

Genetic deletion of fibroblast growth factor 14 recapitulates phenotypic alterations underlying cognitive impairment associated with schizophrenia

T K Alshammari et al. Transl Psychiatry. .

Abstract

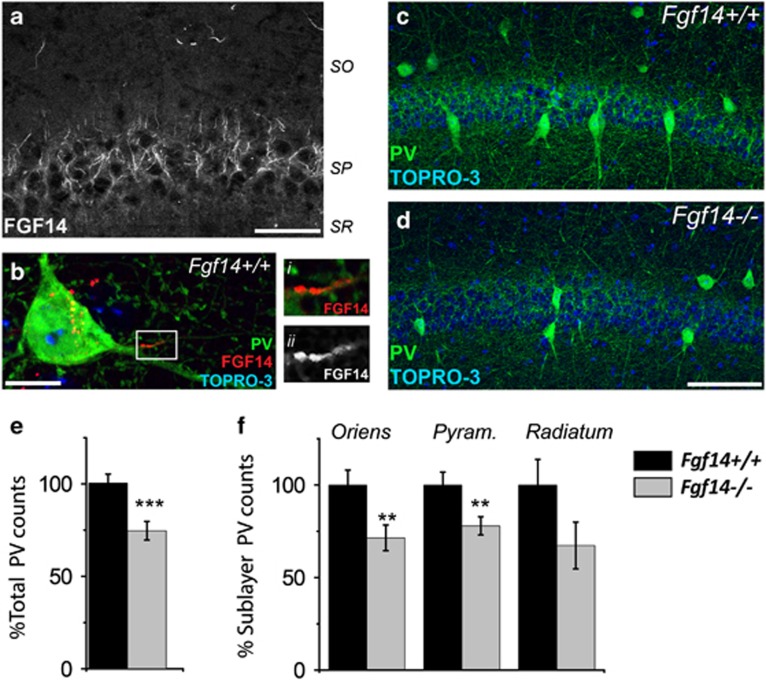
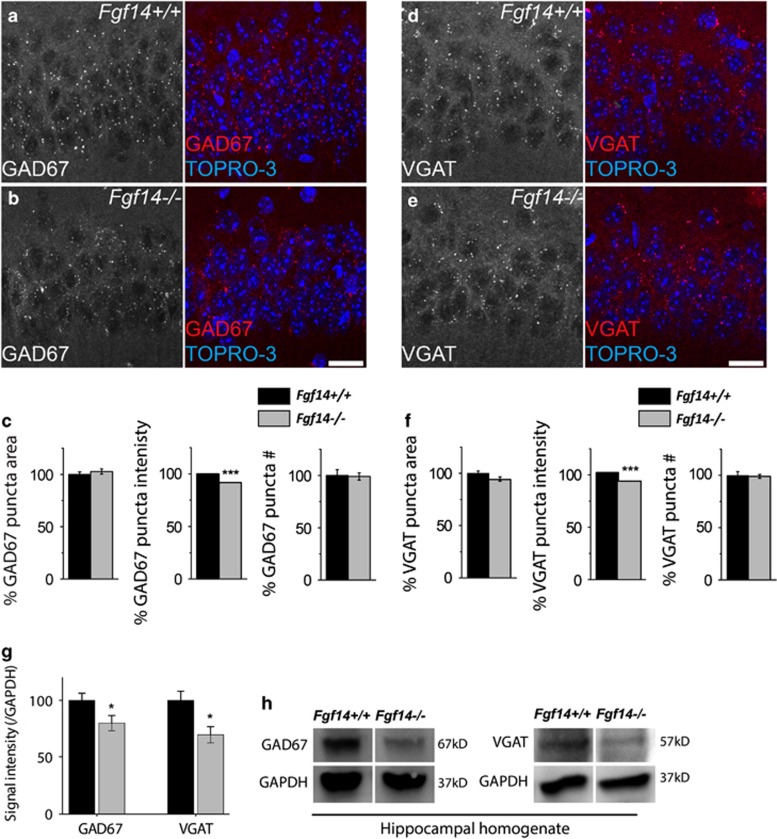
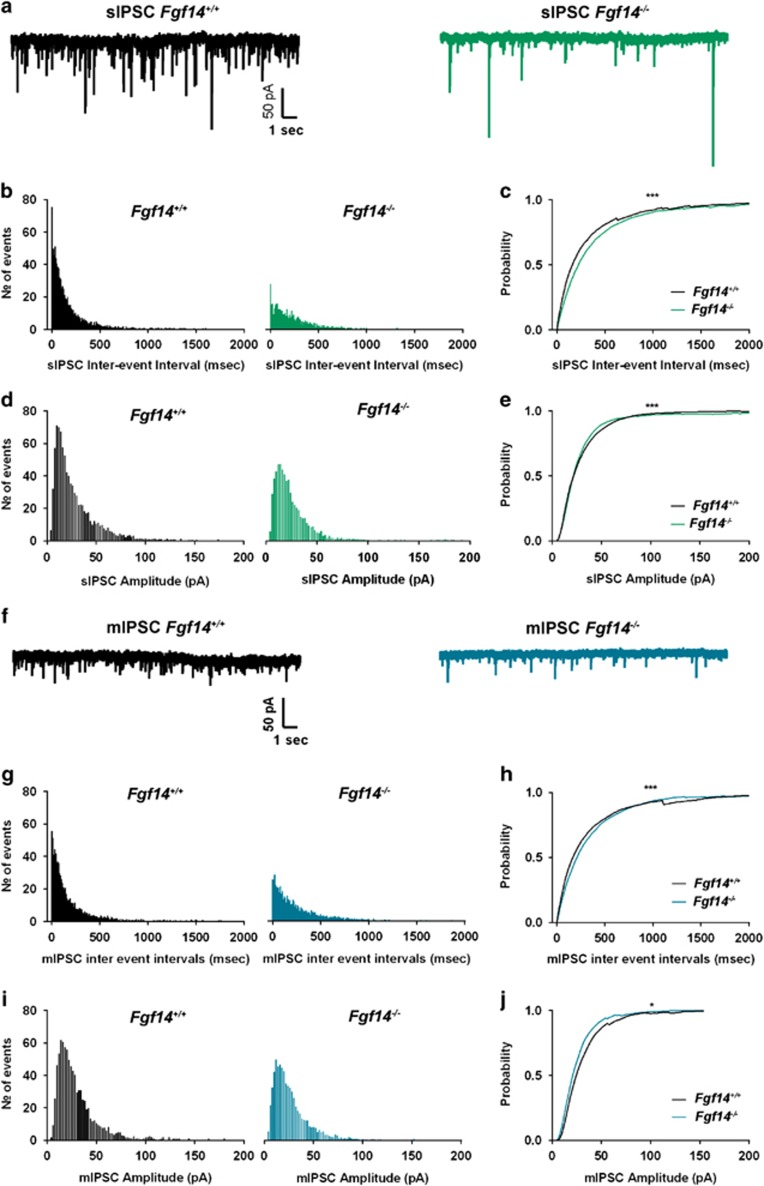
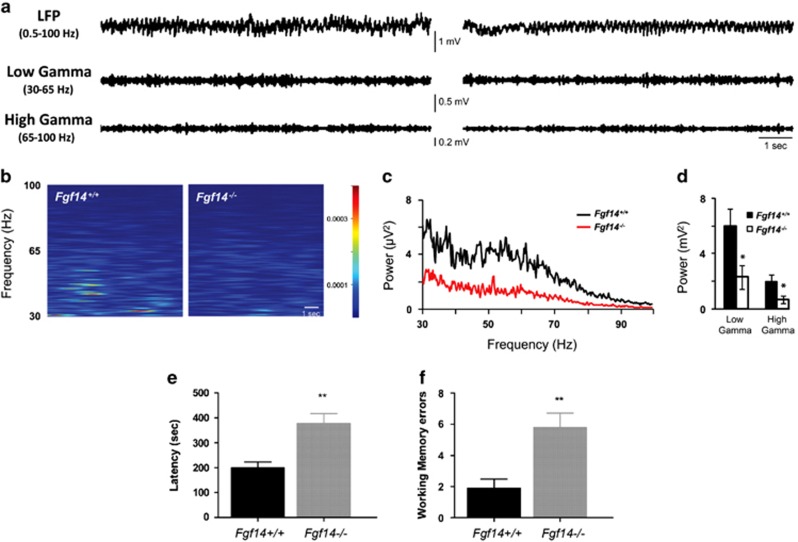
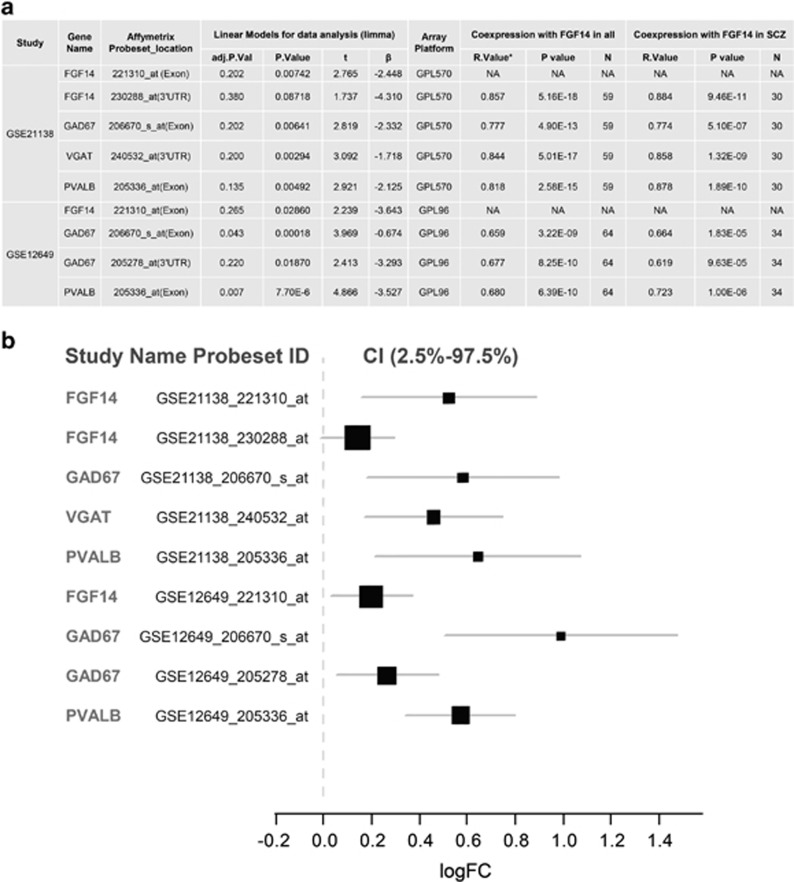
Cognitive processing is highly dependent on the functional integrity of gamma-amino-butyric acid (GABA) interneurons in the brain. These cells regulate excitability and synaptic plasticity of principal neurons balancing the excitatory/inhibitory tone of cortical networks. Reduced function of parvalbumin (PV) interneurons and disruption of GABAergic synapses in the cortical circuitry result in desynchronized network activity associated with cognitive impairment across many psychiatric disorders, including schizophrenia. However, the mechanisms underlying these complex phenotypes are still poorly understood. Here we show that in animal models, genetic deletion of fibroblast growth factor 14 (Fgf14), a regulator of neuronal excitability and synaptic transmission, leads to loss of PV interneurons in the CA1 hippocampal region, a critical area for cognitive function. Strikingly, this cellular phenotype associates with decreased expression of glutamic acid decarboxylase 67 (GAD67) and vesicular GABA transporter (VGAT) and also coincides with disrupted CA1 inhibitory circuitry, reduced in vivo gamma frequency oscillations and impaired working memory. Bioinformatics analysis of schizophrenia transcriptomics revealed functional co-clustering of FGF14 and genes enriched within the GABAergic pathway along with correlatively decreased expression of FGF14, PVALB, GAD67 and VGAT in the disease context. These results indicate that Fgf14(-/-) mice recapitulate salient molecular, cellular, functional and behavioral features associated with human cognitive impairment, and FGF14 loss of function might be associated with the biology of complex brain disorders such as schizophrenia.


Figures

Figure 1
Figure 1
Genetic deletion of Fgf14 results in structural changes in the CA1 parvalbumin (PV) interneurons. (a) FGF14 immunoreactivity is detectable at the axonal initial segment (AIS) of cells in CA1. (b) FGF14 (red) expressed in the soma and AIS of PV interneurons (green), i and ii represent zooms of the boxed area. (c, d) PV interneurons in the CA1 region of Fgf14+/+ and Fgf14−/− mice and respective higher resolution views of PV somas (i and ii). (e, f) Quantification of total PV interneurons in CA1 (380 cells in Fgf14+/+ and 282 in Fgf14−/−), and in specific subfields (oriens, pyramidalis and radiatum). Data represent mean±s.e.m., ***P<0.001; **P<0.02; *P<0.05 statistical differences were assessed by Student's t-test or non-parametric Mann–Whitney test. Scale bars, 40 μm (a); 10 μm (b); 100 μm (d).
Figure 2
Figure 2
The effect of Fgf14 genetic ablation on GABAergic presynaptic proteins in the hippocampal CA1 region. (a, b) GAD67 representative puncta in CA1 stratum pyramidalis (SP) at high magnification. (c) Quantification of GAD67 puncta area, puncta intensity and puncta number in the indicated genotypes. (d, e) Vesicular GABA transporter (VGAT) representative puncta in CA1 SP at high magnification. (f) Quantification of VGAT puncta area, puncta intensity and puncta number in the indicated genotypes. (g) Quantitative western blot analysis of GAD67 and VGAT from the hippocampus. (h) Immunoblot detection of GAD67 and VGAT in whole hippocampal homogenates from Fgf14−/−mice and Fgf14+/+ controls. Data represent mean±s.e.m., ***P<0.001; **P<0.02; *P<0.05 statistical differences were assessed by Student's t-test or non-parametric Mann–Whitney test. Scale bars, 20 μm (a, d). GABA, gamma-amino-butyric acid; GAD67, glutamic acid decarboxylase 67.
Figure 3
Figure 3
Genetic deletion of Fgf14 impairs GABAergic transmission in the CA1 region. Representative traces of whole-cell patch-clamp recordings showing effect of Fgf14 ablation on spontaneous inhibitory postsynaptic current (sIPSCs) (a) and miniature inhibitory postsynaptic current (mIPSCs) (f). (b) Inter-event-interval distribution of spontaneous GABAergic events in Fgf14+/+ (n=8 cells) and Fgf14−/−(n=10 cells) mice. (c) Inter-event-interval cumulative distribution plot for Fgf14+/+ and Fgf14−/−(sIPSCs; ***P<0.001, Kolmogorov–Smirnov test). (d) Amplitude distribution of spontaneous GABAergic events in Fgf14+/+ (n=8 cells) and Fgf14−/− (n=10 cells) mice. (e) Amplitude cumulative distribution plot for Fgf14+/+ and Fgf14−/− sIPSCs (***P<0.001; Kolmogorov–Smirnov test). (g) Inter-event-interval distribution of miniature GABAergic events in Fgf14+/+ (n=6 cells) and Fgf14−/− (n=7 cells) mice. (h) Inter-event-interval cumulative distribution plot for Fgf14+/+ and Fgf14−/− mIPSCs (***P<0.001 with Kolmogorov–Smirnov test). (i) Amplitude distribution of miniature GABAergic events in Fgf14+/+ (n=6 cells) and Fgf14−/− (n=7 cells) mice. (j) Amplitude cumulative distribution plot for Fgf14+/+ and Fgf14−/− sIPSCs (*P<0.05; Kolmogorov–Smirnov test).
Figure 4
Figure 4
Genetic deletion of Fgf14 reduces gamma frequency and affects working memory. (a) Representative traces of 10-s in vivo electroencephalogram recordings in the CA1 region of hippocampus (local field potential; LFP) in Fgf14+/+ (left) and Fgf14−/− mice (right); filtered traces within low- and high-gamma band are also shown. (b) Spectrogram analysis of the above-mentioned traces in the gamma range (30–100 Hz). (c) Mean power spectral density of CA1 activity showing a marked decrease in gamma power in Fgf14−/− (n=7) with respect to Fgf14+/+ (n=7) mice, as revealed by power analysis within both low- and high gamma (d). (e) Fgf14−/− mice required a longer time to perform the eight-arm maze test (n=20 wild type and n=19 Fgf14−/−; P<0.001, t-test). (f) Analysis of working memory errors committed during the test day showed a significant difference between genotypes (P<0.05, t-test). Data are expressed as mean±s.e.m. *P<0.05.
Figure 5
Figure 5
Differential gene expression and correlation of FGF14, PVALB, VGAT and GAD67 in post-mortem control and schizophrenia samples. (a) The GSE21138 and GSE12649 data sets are both derived from previous studies, and deposited in NCBI Gene Expression Omnibus (GEO). Owing to significant deviation from the mean (>2 s.d.) in FGF14 gene expression (221310_at), five samples were removed from the GSE12649 data set. GPL96 represents Affymetrix Human Genome U133A Array; GPL570 represents Affymetrix Human Genome U133 Plus 2.0 Array. GPL96 had no probeset selected for VGAT (SLC32A1). The original P-value was adjusted by Benjamini and Hochberg (false discovery rate). The R-value represents a Pearson Correlation with significance at the 0.01 level (two-tailed). (b) Forest plot illustrates the effect size (logFC) of differential gene expression of FGF14, PVALB, VGAT and GAD67 between controls and schizophrenia patients in post-mortem dorsolateral prefrontal cortex (DLPFC) (BA46). Linear model and empirical Bayes method (Limma) was applied for assessing the differential gene expression of FGF14 and its co-expression genes, including PVALB, GAD67 and VGAT, in two independent data sets (GSE21138 and GSE12649) deposited in NCBI GEO. LogFC>0 suggest decreased gene expression in patients with schizophrenia. The forest plot was created by R rmeta package. VGAT, vesicular gamma-amino-butyric acid transporter., , ,

References

    1. Lewis DA, Curley AA, Glausier JR, Volk DW. Cortical parvalbumin interneurons and cognitive dysfunction in schizophrenia. Trends Neurosci 2012; 35: 57–67. - PMC - PubMed
    1. Nissen S, Liang S, Shehktman T, Kelsoe JR, Bipolar Genome S, Greenwood TA et al. Evidence for association of bipolar disorder to haplotypes in the 22q12.3 region near the genes stargazin, IFT27 and parvalbumin. Am J Med Genet B Neuropsychiatr Genet 2012; 159B: 941–950. - PMC - PubMed
    1. Yizhar O, Fenno LE, Prigge M, Schneider F, Davidson TJ, O'Shea DJ et al. Neocortical excitation/inhibition balance in information processing and social dysfunction. Nature 2011; 477: 171–178. - PMC - PubMed
    1. Curley AA, Eggan SM, Lazarus MS, Huang ZJ, Volk DW, Lewis DA. Role of glutamic acid decarboxylase 67 in regulating cortical parvalbumin and GABA membrane transporter 1 expression: implications for schizophrenia. Neurobiol Dis 2013; 50: 179–186. - PMC - PubMed
    1. Eggan SM, Lazarus MS, Stoyak SR, Volk DW, Glausier JR, Huang ZJ et al. Cortical glutamic acid decarboxylase 67 deficiency results in lower cannabinoid 1 receptor messenger RNA expression: implications for schizophrenia. Biol Psychiatry 2012; 71: 114–119. - PMC - PubMed

Publication types

MeSH terms

Substances