. 2016 Oct;40(10):1574-1581.
doi: 10.1038/ijo.2016.93. Epub 2016 May 10.

Metabolic shifts toward fatty-acid usage and increased thermogenesis are associated with impaired adipogenesis in mice expressing human APOE4

Affiliations

Metabolic shifts toward fatty-acid usage and increased thermogenesis are associated with impaired adipogenesis in mice expressing human APOE4

J M Arbones-Mainar et al. Int J Obes (Lond). 2016 Oct.

Abstract

Background: The Apolipoprotein E (APOE) gene encodes for three isoforms in the human population (APOE2, APOE3 and APOE4). Whereas the role of APOE in lipid metabolism is well characterized, the specific metabolic signatures of the APOE isoforms during metabolic disorders, remain unclear.

Objective: To elucidate the molecular underpinnings of APOE-directed metabolic alterations, we tested the hypothesis that APOE4 drives a whole-body metabolic shift toward increased lipid oxidation.

Methods: We employed humanized mice in which the Apoe gene has been replaced by the human APOE*3 or APOE*4 allele to produce human APOE3 or APOE4 proteins and characterized several mechanisms of fatty-acid oxidation, lipid storage, substrate utilization and thermogenesis in those mice.

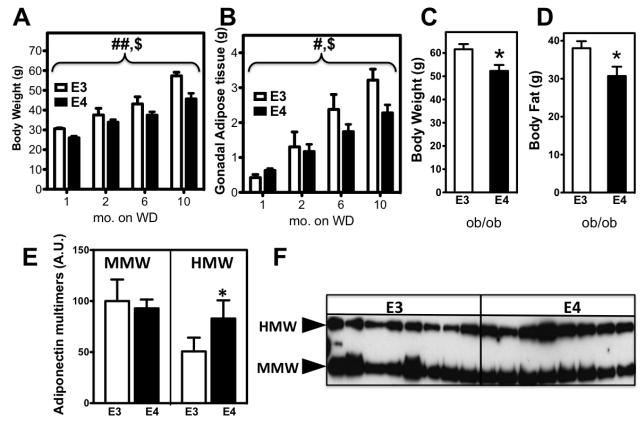
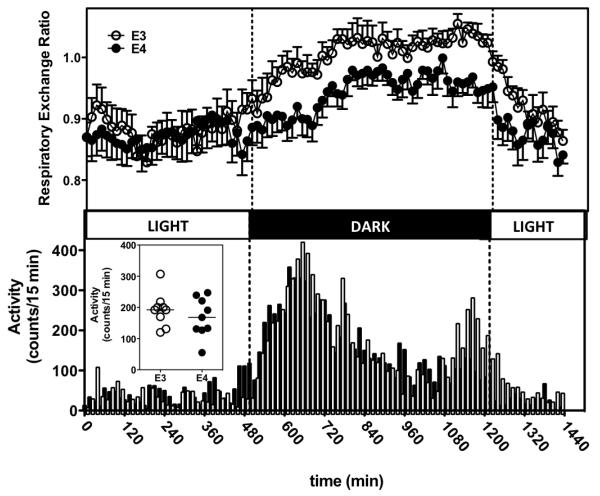
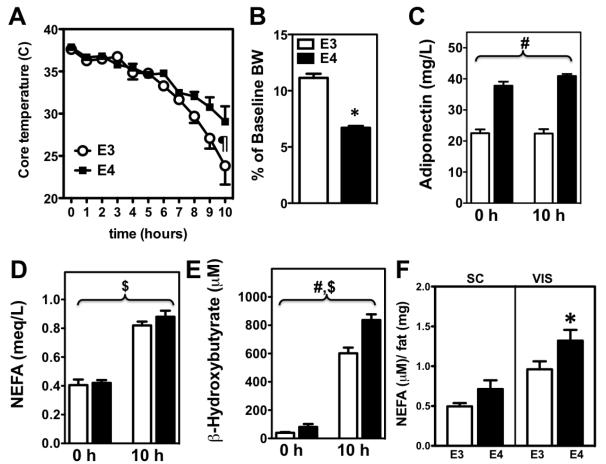
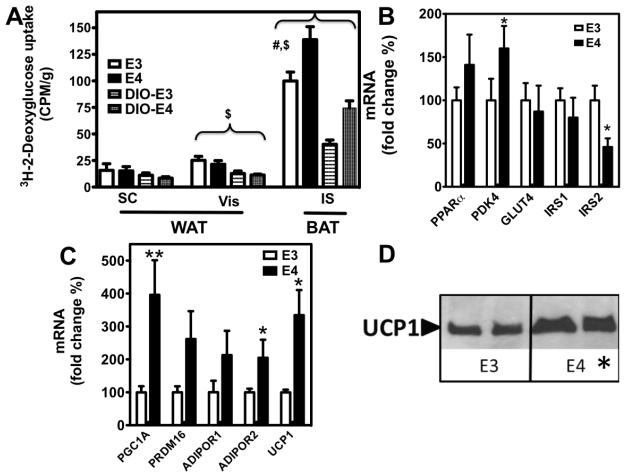
Results: We show that, whereas APOE4 mice gained less body weight and mass than their APOE3 counterparts on a Western-type diet (P<0.001), they displayed elevated insulin and homeostatic model assessment, markers of insulin resistance (P=0.004 and P=0.025, respectively). APOE4 mice also demonstrated a reduced respiratory quotient during the postprandial period (0.95±0.03 versus 1.06±0.03, P<0.001), indicating increased usage of lipids as opposed to carbohydrates as a fuel source. Finally, APOE4 mice showed increased body temperature (37.30±0.68 versus 36.9±0.58 °C, P=0.039), augmented cold tolerance and more metabolically active brown adipose tissue compared with APOE3 mice.

Conclusion: These data suggest that APOE4 mice may resist weight gain via an APOE4-directed global metabolic shift toward lipid oxidation and enhanced thermogenesis, and may represent a critical first step in the development of APOE-directed therapies for a large percentage of the population affected by disorders with established links to APOE and metabolism.


Figures

Figure 1
Figure 1
Two-month old APOE3 and APOE4 mice were fed a Western-type diet and euthanized after different periods on the diet (n=5 for each genotype at any given time point), then total body weight (A) and gonadal adipose mass (B) were measured. # p=0.05, ## p<0.001 for WD-APOE3 vs WD-APOE4, $ p<0.001 time on diet, 2-way ANOVA. Similarly, APOE3-ob/ob and APOE4-ob/ob mice (n = 5 for each genotype) were weaned and fed for 3 months a standard laboratory diet and body weight (C), as well as total fat mass measured by DEXA (D) were determined. n = 6 mice/genotype. *p<0.05, **p<0.01, t-test. Plasma adiponectin levels in APOE3 and APOE4 mice fed a Western-type diet for 2 months was analyzed by non-denaturing SDS-PAGE into its medium molecular weight (MMW) and higher molecular weight (HMW) fractions (A). A representative profile is shown in (B) with the ratio (HMW/MMW) between fractions. (n=8 per genotype). *p<0.05, t-test.
Figure 2
Figure 2
Two-month old APOE3 and APOE4 mice fed standard laboratory chow were individually housed in a comprehensive lab animal monitoring system (CLAMS) and allowed to a 24-hour acclimation period. Respiratory Exchange Ratio, RER (Upper panel). p<0.001 for differences between APOE3 and APOE4 and p<0.001 for light vs. dark, 2-way ANOVA. Locomotor Activity was recorded as the number of successive infrared beam breaks in 15 min time binds. (Lower panel) during 24 hours. Inset shows the average Locomotor Activity per individual mouse. Lighting regimes are represented by bars above each graph (solid bars denote dark phase, and open bars denote light phase). Values are expressed as the group mean ± SEM ; n = 8 for each genotype.
Figure 3
Figure 3
Fasting mice were individually housed at at 7°C for up to 10 h and core temperature was measured hourly with a rectal probe, ¶ p<0.05 genotype effect, repeated-measures ANOVA. (A). Percentage of body weight lost (B) and plasma NEFA (C), adiponectin (E), and the ketone body β-hydroxybutyrate (F) were determined at the begining (0 h) and at the end (10 h) of the cold challenge. Averaged data from 2 different cohorts of APOE3 (white bars) and APOE4 (black bars) mice are presented as mean ± SEM ; n = 8 mice for each genotype and cohort . # p<0.001 for APOE3 vs. APOE4, $ p<0.001 for standard vs. obesogenic diet, 2-way ANOVA. * p < 0.05, t-test Release of NEFA into the medium by explants of subcutaneous inguinal (SC) and epididymal visceral (VIS) fat over 24 h at 37 °C (E). NEFA release was measured as described in Methods. Results are micromoles of NEFA released by milligram of tissue protein. Each column represents the mean ± SEM for 5 mice. * p < 0.05, t-test
Figure 4
Figure 4
Glucose uptake was measured in APOE3, APOE4, DIO-APOE3 and DIO-APOE4 mice. Mice were fed a standard laboratory chow or an obesogenic diet (DIO) for six months. Following a four hour fast, mice were given an intravenous bolus of 2-[1,2-3H (N)]-Deoxy-D-glucose and its accumulation was measured in subcutaneous (SC) and visceral (Vis) white adipose depots (WAT) as well as intrascapular (IS) brown adipose tissue (BAT). (# p<0.001 for APOE3 vs. APOE4, $ p<0.001 for standard vs. obesogenic diet, 2-way ANOVA)(A). Effects of APOE allele and feeding on expression of representative genes in the gastrocnemius skeletal muscle (B) and intrascapular BAT (C). UCP1 protein expression in BAT as determined by immunoblot assay. Protein loading was evaluated by Ponceau S staining (D).* p<0.05, **p<0.01 for the difference between APOE3 and APOE4, t-test.

References

    1. Davignon J, Gregg RE, Sing CF. Apolipoprotein E polymorphism and atherosclerosis. Arterioscler Thromb Vasc Biol. 1988;8:1–21. - PubMed
    1. Bennet AM, Di Angelantonio E, Ye Z, Wensley F, Dahlin A, Ahlbom A, et al. Association of apolipoprotein E genotypes with lipid levels and coronary risk. JAMA. 2007;298:1300–11. - PubMed
    1. Dart A, Sherrard B, Simpson H. Influence of apo E phenotype on postprandial triglyceride and glucose responses in subjects with and without coronary heart disease. Atherosclerosis. 1997;130:161–70. - PubMed
    1. Elosua R, Demissie S, Cupples LA, Meigs JB, Wilson PWF, Schaefer EJ, et al. Obesity modulates the association among APOE genotype, insulin, and glucose in men. Obes Res. 2003;11:1502–8. - PubMed
    1. Torres-Perez E, Ledesma M, Garcia-Sobreviela MP, Leon-Latre M, Arbones-Mainar JM. Apolipoprotein E4 association with metabolic syndrome depends on body fatness. Atherosclerosis. 2016;245:35–42. - PubMed

Publication types