

Targeted Sequencing and Meta-Analysis of Preterm Birth
- PMID: 27163930
- PMCID: PMC4862658
- DOI: 10.1371/journal.pone.0155021
Targeted Sequencing and Meta-Analysis of Preterm Birth
Abstract
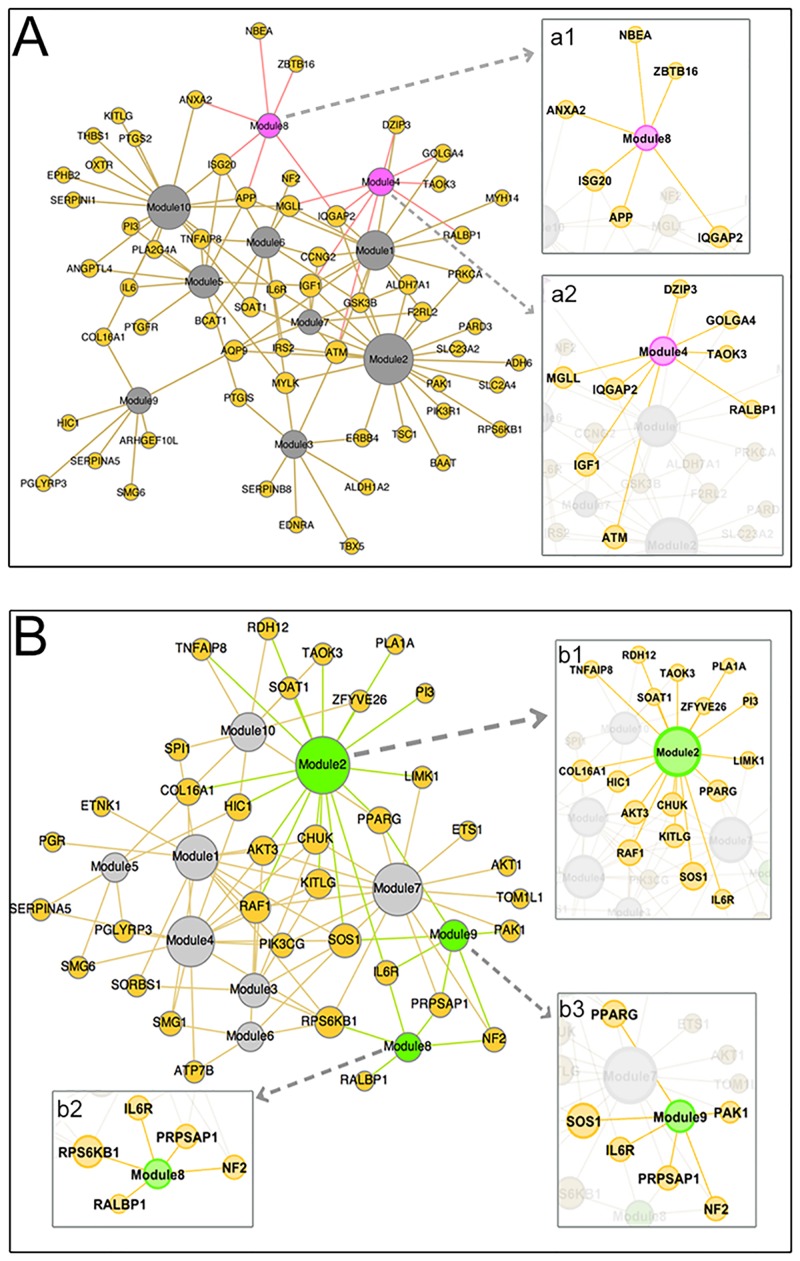
Understanding the genetic contribution(s) to the risk of preterm birth may lead to the development of interventions for treatment, prediction and prevention. Twin studies suggest heritability of preterm birth is 36-40%. Large epidemiological analyses support a primary maternal origin for recurrence of preterm birth, with little effect of paternal or fetal genetic factors. We exploited an "extreme phenotype" of preterm birth to leverage the likelihood of genetic discovery. We compared variants identified by targeted sequencing of women with 2-3 generations of preterm birth with term controls without history of preterm birth. We used a meta-genomic, bi-clustering algorithm to identify gene sets coordinately associated with preterm birth. We identified 33 genes including 217 variants from 5 modules that were significantly different between cases and controls. The most frequently identified and connected genes in the exome library were IGF1, ATM and IQGAP2. Likewise, SOS1, RAF1 and AKT3 were most frequent in the haplotype library. Additionally, SERPINB8, AZU1 and WASF3 showed significant differences in abundance of variants in the univariate comparison of cases and controls. The biological processes impacted by these gene sets included: cell motility, migration and locomotion; response to glucocorticoid stimulus; signal transduction; metabolic regulation and control of apoptosis.
Conflict of interest statement
Figures


Similar articles
-
Whole exome sequencing reveals HSPA1L as a genetic risk factor for spontaneous preterm birth.PLoS Genet. 2018 Jul 12;14(7):e1007394. doi: 10.1371/journal.pgen.1007394. eCollection 2018 Jul. PLoS Genet. 2018. PMID: 30001343 Free PMC article.
-
Spontaneous preterm birth: advances toward the discovery of genetic predisposition.Am J Obstet Gynecol. 2018 Mar;218(3):294-314.e2. doi: 10.1016/j.ajog.2017.12.009. Epub 2017 Dec 14. Am J Obstet Gynecol. 2018. PMID: 29248470 Free PMC article. Review.
-
Discovery of rare ancestry-specific variants in the fetal genome that confer risk of preterm premature rupture of membranes (PPROM) and preterm birth.BMC Med Genet. 2018 Oct 5;19(1):181. doi: 10.1186/s12881-018-0696-4. BMC Med Genet. 2018. PMID: 30290772 Free PMC article.
-
Influence of MBL2 and NOS3 polymorphisms on spontaneous preterm birth in North East Brazil: genetics and preterm birth.J Matern Fetal Neonatal Med. 2020 Jan;33(1):127-135. doi: 10.1080/14767058.2018.1487938. Epub 2018 Jul 22. J Matern Fetal Neonatal Med. 2020. PMID: 29886784
-
Recent advances in the genetics of preterm birth.Ann Hum Genet. 2020 May;84(3):205-213. doi: 10.1111/ahg.12373. Epub 2019 Dec 19. Ann Hum Genet. 2020. PMID: 31853956 Free PMC article. Review.
Cited by
-
Whole exome sequencing reveals HSPA1L as a genetic risk factor for spontaneous preterm birth.PLoS Genet. 2018 Jul 12;14(7):e1007394. doi: 10.1371/journal.pgen.1007394. eCollection 2018 Jul. PLoS Genet. 2018. PMID: 30001343 Free PMC article.
-
A genome-wide and candidate gene association study of preterm birth in Korean pregnant women.PLoS One. 2023 Nov 29;18(11):e0294948. doi: 10.1371/journal.pone.0294948. eCollection 2023. PLoS One. 2023. PMID: 38019868 Free PMC article.
-
A Systematic Review of Extreme Phenotype Strategies to Search for Rare Variants in Genetic Studies of Complex Disorders.Genes (Basel). 2020 Aug 25;11(9):987. doi: 10.3390/genes11090987. Genes (Basel). 2020. PMID: 32854191 Free PMC article.
-
Gene Expression Behavior of a Set of Genes in Platelet and Tissue Samples from Patients with Breast Cancer.Int J Mol Sci. 2023 May 6;24(9):8348. doi: 10.3390/ijms24098348. Int J Mol Sci. 2023. PMID: 37176055 Free PMC article.
-
Exome sequencing identifies gene variants and networks associated with extreme respiratory outcomes following preterm birth.BMC Genet. 2018 Oct 20;19(1):94. doi: 10.1186/s12863-018-0679-7. BMC Genet. 2018. PMID: 30342483 Free PMC article.
References
-
- Ventura SJ, Hamilton BE, Mathews TJ, Centers for Disease C, Prevention. Pregnancy and childbirth among females aged 10–19 years—United States, 2007–2010. Morbidity and mortality weekly report Surveillance summaries. 2013;62 Suppl 3:71–6. Epub 2013/11/23. .
-
- Adams MM, Elam-Evans LD, Wilson HG, Gilbertz DA. Rates of and factors associated with recurrence of preterm delivery. Jama. 2000;283(12):1591–6. Epub 2000/03/29. . - PubMed
-
- Ekwo E, Moawad A. The risk for recurrence of premature births to African-American and white women. Journal of the Association for Academic Minority Physicians: the official publication of the Association for Academic Minority Physicians. 1998;9(1):16–21. Epub 1998/05/20. . - PubMed
-
- Allen MC, Alexander GR, Tompkins ME, Hulsey TC. Racial differences in temporal changes in newborn viability and survival by gestational age. Paediatric and perinatal epidemiology. 2000;14(2):152–8. Epub 2000/05/03. . - PubMed
Publication types
MeSH terms
Substances
Grants and funding
LinkOut - more resources
Full Text Sources
Other Literature Sources
Research Materials
Miscellaneous
