. 2016 Jun 20;141(13):4142-50.
doi: 10.1039/c6an00295a.

Computational cell analysis for label-free detection of cell properties in a microfluidic laminar flow

Affiliations

Computational cell analysis for label-free detection of cell properties in a microfluidic laminar flow

Alex Ce Zhang et al. Analyst. .

Abstract

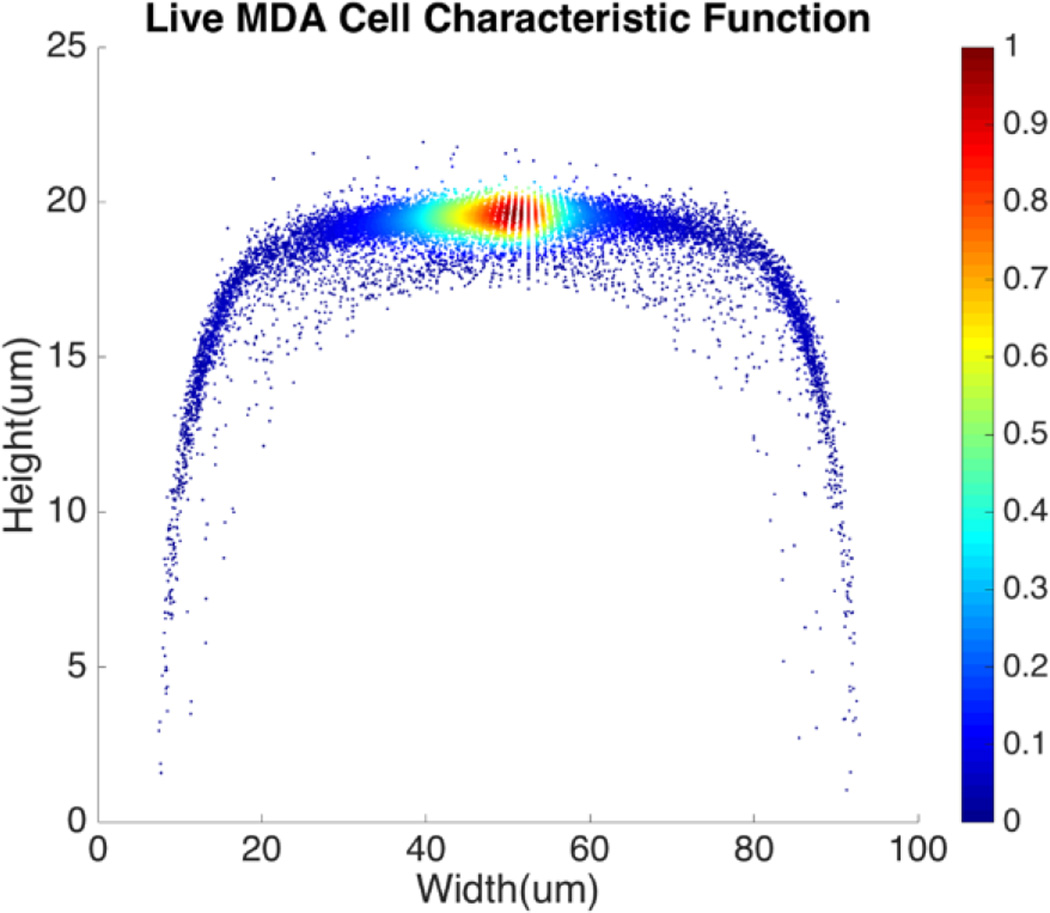
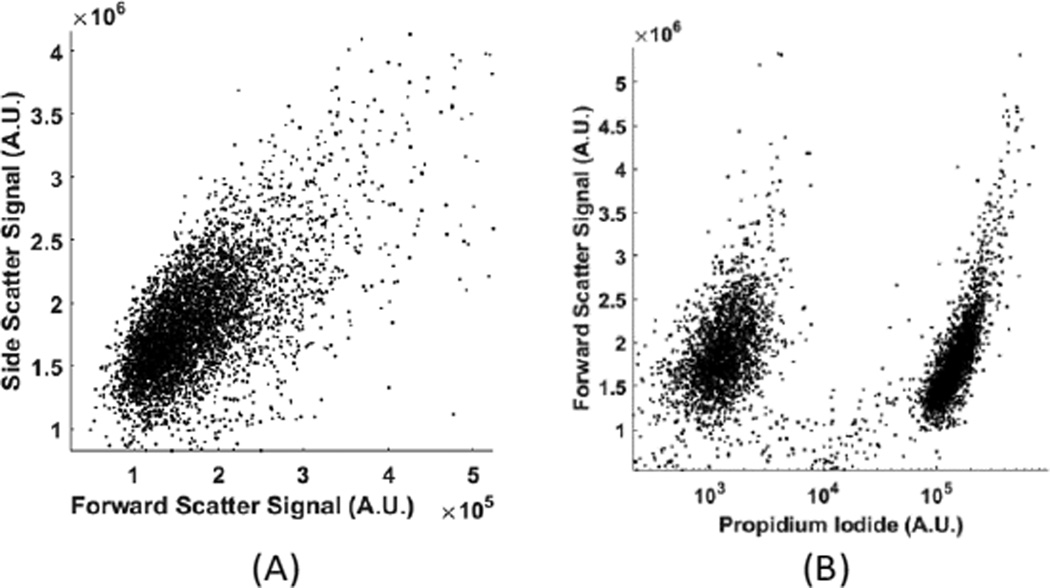
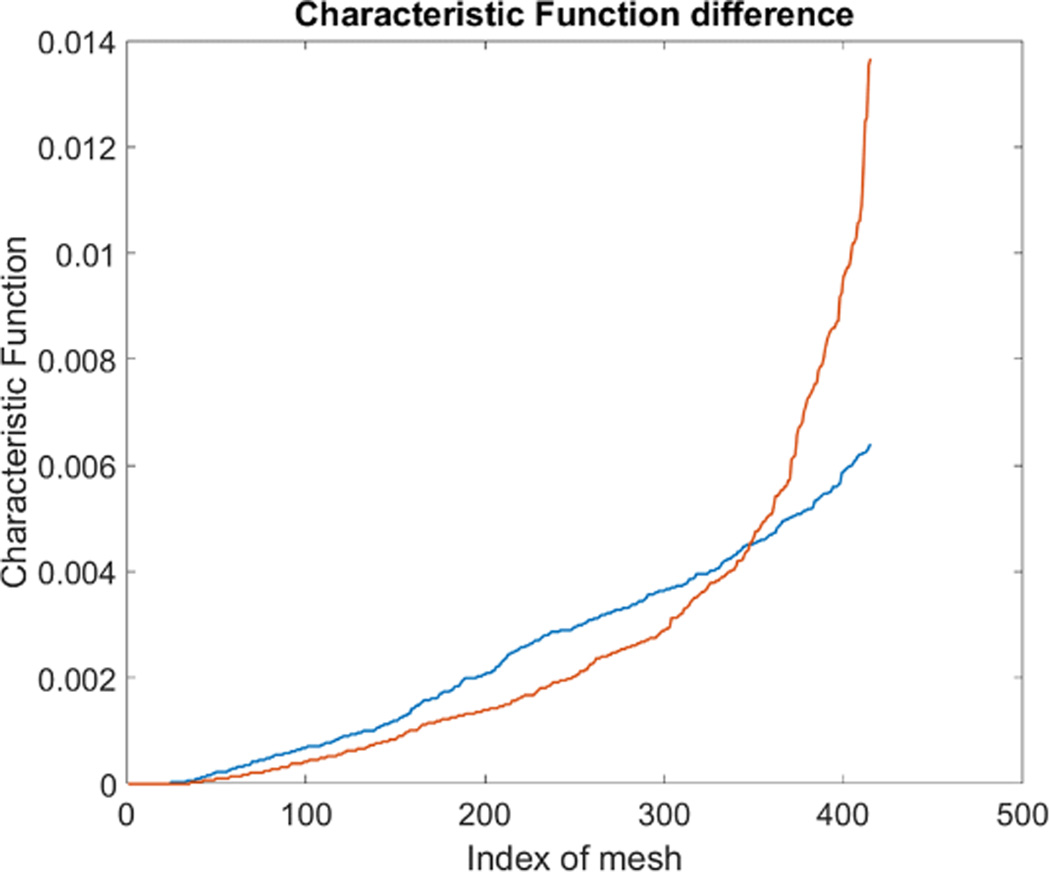
Although a flow cytometer, being one of the most popular research and clinical tools for biomedicine, can analyze cells based on the cell size, internal structures such as granularity, and molecular markers, it provides little information about the physical properties of cells such as cell stiffness and physical interactions between the cell membrane and fluid. In this paper, we propose a computational cell analysis technique using cells' different equilibrium positions in a laminar flow. This method utilizes a spatial coding technique to acquire the spatial position of the cell in a microfluidic channel and then uses mathematical algorithms to calculate the ratio of cell mixtures. Most uniquely, the invented computational cell analysis technique can unequivocally detect the subpopulation of each cell type without labeling even when the cell type shows a substantial overlap in the distribution plot with other cell types, a scenario limiting the use of conventional flow cytometers and machine learning techniques. To prove this concept, we have applied the computation method to distinguish live and fixed cancer cells without labeling, count neutrophils from human blood, and distinguish drug treated cells from untreated cells. Our work paves the way for using computation algorithms and fluidic dynamic properties for cell classification, a label-free method that can potentially classify over 200 types of human cells. Being a highly cost-effective cell analysis method complementary to flow cytometers, our method can offer orthogonal tests in companion with flow cytometers to provide crucial information for biomedical samples.


Figures

Fig. 1
Fig. 1
Experiment setup with space coding method
Fig. 2
Fig. 2
(a) Spatial mask design with two oppositely oriented trapezoidal slits. W1 and W2 represent the widths of the slits experienced by a cell traversing the mask from different positions. Also shown are the anticipated waveforms for cells crossing the mask area via different paths. (b) Intensity modulated forward scattering signal by the trapezoidal slits.
Fig. 3
Fig. 3
Spatial characteristic function of live MDA-MB-231 cell.
Fig. 4
Fig. 4
Illustration of the steps to calculate the cell ratio in a sample of cell mixture. The yellow and blue patterns represent the characteristic distributions for cell A and cell B.
Fig. 5
Fig. 5
Histogram of the live MDA-MB-231 cell ratio, C.
Fig. 6
Fig. 6
Use of cell mixtures as training samples to obtain the characteristic function of specific cell type.
Fig. 7
Fig. 7
Test Sample Ratio calculation.
Fig. 8
Fig. 8
Spatial distribution of live MDA-MB-231 cells using meshes created by the quad-tree algorithm.
Fig. 9
Fig. 9
(A) Forward and side scattering of live and fixed MDA-MB-231 cells; (B) fluorescent signal of live and fixed MDA-MB-231 cells. The cluster on the left was auto fluorescence from live cells and the cluster on the right was Propidium lodide labelled fluorescent signal from fixed cells.
Fig. 10
Fig. 10
Characteristic function for fixed and live MDA-MB-231 cells.
Fig. 11
Fig. 11
Characteristic function difference between live(Orange) and fixed(Blue) MDA-MB-231 cells. The steeper rise in the orange curve indicates that the live MDA cells are spatially more concentrated to certain ares in the channel than the fixed MDA cells.
Fig. 12
Fig. 12
Measured mean value of live cell percentage in 4 samples. The error bars show the variations for 10 repeats for cytometer (Accuri C6).
Fig. 13
Fig. 13
Neutrophil and Non-neutrophil characteristic functions.
Fig. 14
Fig. 14
Measured mean value of neutrophil percentage over WBCs in 3 samples. The error bars show the variations for 10 repeats for each sample using our method and a commercial flow cytometer (Accuri C6).
Fig. 15
Fig. 15
Difference in characteristic function for MDA-MB-231 cell with (Blue) and without (Orange) Paclitaxel treatment. The steeper rise in the blue curve indicates that the Paclitaxel treated cells are spatially more concentrated to certain ares in the channel than the untreated cells.
Fig. 16
Fig. 16
(A) is the fluorescent microscope picture of GFP transfected MDA-MB-231 cells without Paclitaxel treatment. (B) is fluorescent microscope picture of GFP transfected MDA-MB-231 cells with Paclitaxel treatment. It is difficult to tell the morphological differences using conventional histology.

References

    1. Godin Jessica, et al. Microfluidics and photonics for Bio-System-on-a-Chip: A review of advancements in technology towards a microfluidic flow cytometry chip. Journal of biophotonics. 2008;1.5:355. - PMC - PubMed
    1. Pang Lin, et al. Optofluidic devices and applications in photonics, sensing and imaging. Lab on a Chip. 2012;12.19:3543–3551. - PubMed
    1. Piorek Brian D, et al. Free-surface microfluidic control of surface-enhanced Raman spectroscopy for the optimized detection of airborne molecules. Proceedings of the National Academy of Sciences. 2007;104.48:18898–18901. - PMC - PubMed
    1. Wu Jigang, Zheng Guoan, Lee Lap Man. Optical imaging techniques in microfluidics and their applications. Lab on a Chip. 2012;12.19:3566–3575. - PubMed
    1. Monat C, Domachuk P, Eggleton BJ. Integrated optofluidics: A new river of light. Nature photonics. 2007;1.2:106–114.