

DNA cytosine hydroxymethylation levels are distinct among non-overlapping classes of peripheral blood leukocytes
- PMID: 27164004
- PMCID: PMC5131182
- DOI: 10.1016/j.jim.2016.05.003
DNA cytosine hydroxymethylation levels are distinct among non-overlapping classes of peripheral blood leukocytes
Abstract
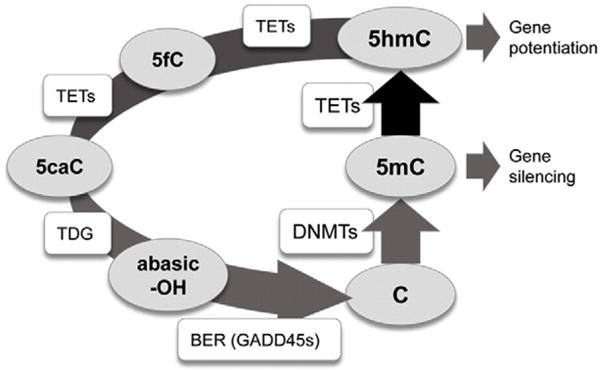
Background: Peripheral blood leukocytes are the most commonly used surrogates to study epigenome-induced risk and epigenomic response to disease-related stress. We considered the hypothesis that the various classes of peripheral leukocytes differentially regulate the synthesis of 5-methylcytosine (5mCG) and its removal via Ten-Eleven Translocation (TET) dioxygenase catalyzed hydroxymethylation to 5-hydroxymethylcytosine (5hmCG), reflecting their responsiveness to environment. Although it is known that reductions in TET1 and/or TET2 activity lead to the over-proliferation of various leukocyte precursors in bone marrow and in development of chronic myelomonocytic leukemia and myeloproliferative neoplasms, the role of 5mCG hydroxymethylation in peripheral blood is less well studied.
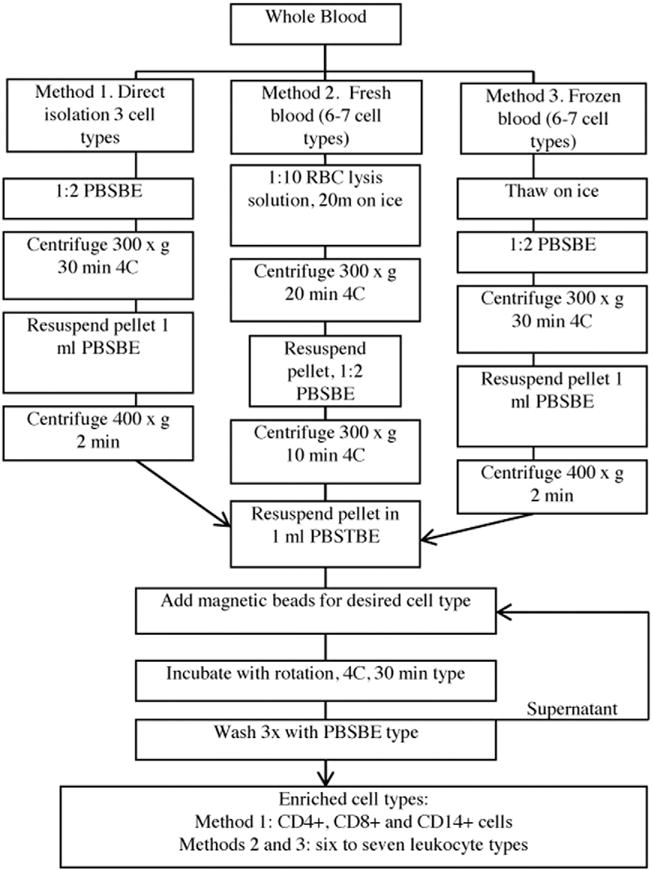
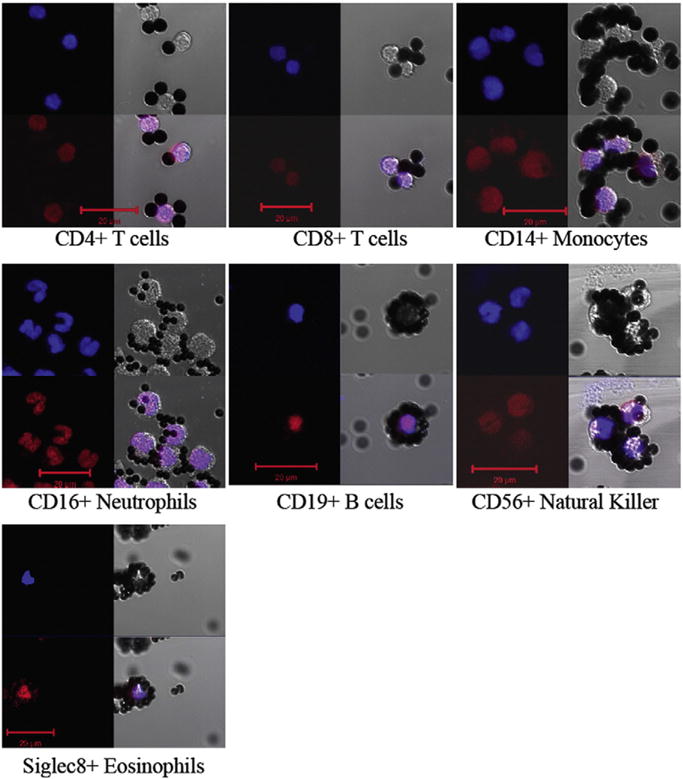
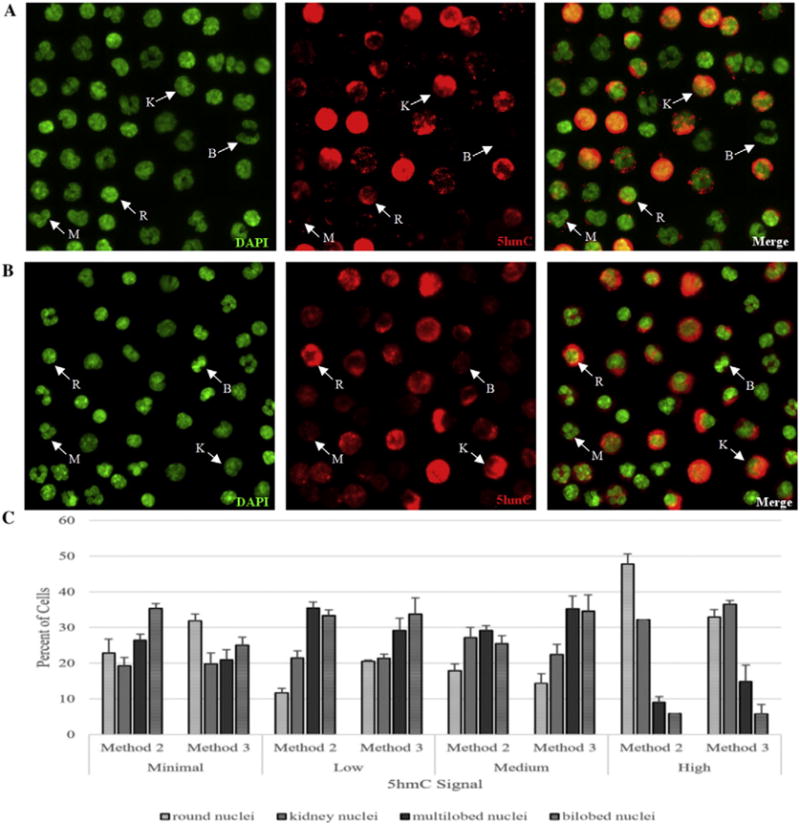
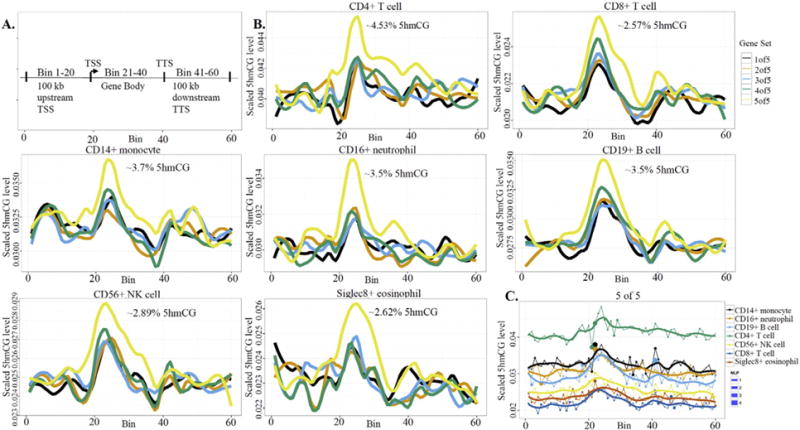
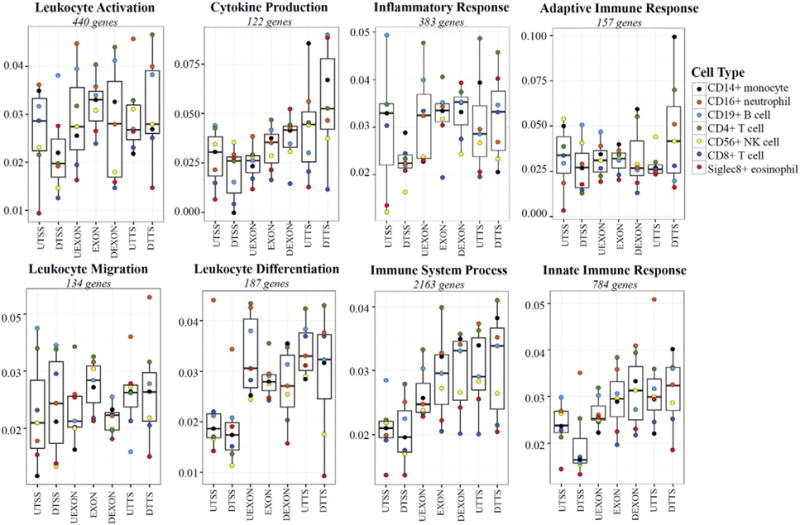
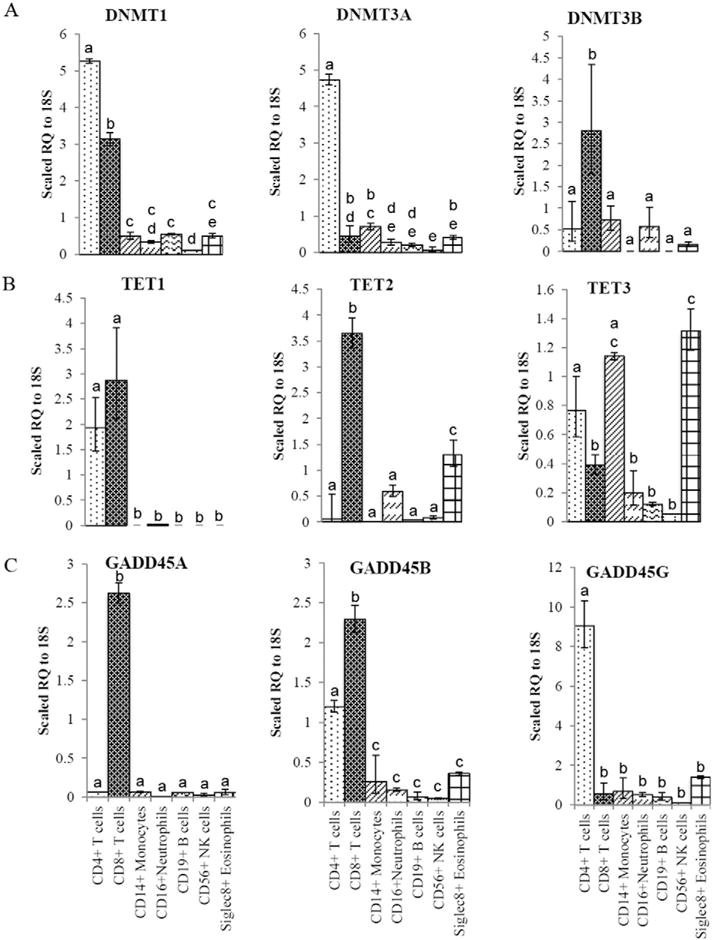
Results: We developed simplified protocols to rapidly and reiteratively isolate non-overlapping leukocyte populations from a single small sample of fresh or frozen whole blood. Among peripheral leukocyte types we found extreme variation in the levels of transcripts encoding proteins involved in cytosine methylation (DNMT1, 3A, 3B), the turnover of 5mC by demethylation (TET1, 2, 3), and DNA repair (GADD45A, B, G) and in the global and gene-region-specific levels of DNA 5hmCG (CD4+ T cells≫CD14+ monocytes>CD16+ neutrophils>CD19+ B cells>CD56+ NK cells>Siglec8+ eosinophils>CD8+ T cells).
Conclusions: Our data taken together suggest a potential hierarchy of responsiveness among classes of leukocytes with CD4+, CD8+ T cells and CD14+ monocytes being the most distinctly poised for a rapid methylome response to physiological stress and disease.
Keywords: 5-Hydroxymethylcytosine; Cellular memory; Disease; Epigenetic control; Epigenome-induced risk; Surrogate cells.
Copyright © 2016 The Authors. Published by Elsevier B.V. All rights reserved.
Conflict of interest statement
The authors declare no competing interests related to this manuscript.
Figures
Similar articles
-
CD4+ and CD8+ T-Cell-Specific DNA Cytosine Methylation Differences Associated With Obesity.Obesity (Silver Spring). 2018 Aug;26(8):1312-1321. doi: 10.1002/oby.22225. Epub 2018 Jun 28. Obesity (Silver Spring). 2018. PMID: 29956501 Free PMC article.
-
Genomic distribution and possible functions of DNA hydroxymethylation in the brain.Genomics. 2014 Nov;104(5):341-6. doi: 10.1016/j.ygeno.2014.08.020. Epub 2014 Sep 7. Genomics. 2014. PMID: 25205307 Review.
-
5-hydroxymethylcytosine accumulation in postmitotic neurons results in functional demethylation of expressed genes.Proc Natl Acad Sci U S A. 2017 Sep 12;114(37):E7812-E7821. doi: 10.1073/pnas.1708044114. Epub 2017 Aug 28. Proc Natl Acad Sci U S A. 2017. PMID: 28847947 Free PMC article.
-
Hypomethylation of LINE-1 repeat elements and global loss of DNA hydroxymethylation in vapers and smokers.Epigenetics. 2020 Aug;15(8):816-829. doi: 10.1080/15592294.2020.1724401. Epub 2020 Feb 5. Epigenetics. 2020. PMID: 31996072 Free PMC article.
-
5-hydroxymethylcytosine: a potential therapeutic target in cancer.Epigenomics. 2014;6(5):503-14. doi: 10.2217/epi.14.39. Epigenomics. 2014. PMID: 25431943 Review.
Cited by
-
Relationship between DLEC1 and PBX3 promoter methylation and the risk and prognosis of gastric cancer in peripheral blood leukocytes.J Cancer Res Clin Oncol. 2020 May;146(5):1115-1124. doi: 10.1007/s00432-020-03171-4. Epub 2020 Mar 6. J Cancer Res Clin Oncol. 2020. PMID: 32144534 Free PMC article.
-
Hydroxymethylation profile of cell-free DNA is a biomarker for early colorectal cancer.Sci Rep. 2022 Oct 4;12(1):16566. doi: 10.1038/s41598-022-20975-1. Sci Rep. 2022. PMID: 36195648 Free PMC article.
-
CD4+ and CD8+ T-Cell-Specific DNA Cytosine Methylation Differences Associated With Obesity.Obesity (Silver Spring). 2018 Aug;26(8):1312-1321. doi: 10.1002/oby.22225. Epub 2018 Jun 28. Obesity (Silver Spring). 2018. PMID: 29956501 Free PMC article.
-
Global DNA (hydroxy)methylation is stable over time under several storage conditions and temperatures.Epigenetics. 2021 Jan;16(1):45-53. doi: 10.1080/15592294.2020.1786318. Epub 2020 Jul 2. Epigenetics. 2021. PMID: 32614650 Free PMC article.
References
-
- Alberts B, Johnson A, Lewis J, Raff M, Roberts K, Walter P. Garland Science. Taylor and Francis Group; New York: 1994. Molecular biology of the cell.
-
- Almen MS, Nilsson EK, Jacobsson JA, Kalnina I, Klovins J, Fredriksson R, Schioth HB. Genome-wide analysis reveals DNA methylation markers that vary with both age and obesity. Gene. 2014;548:61–67. - PubMed
-
- Bossuyt X, Marti GE, Fleisher TA. Comparative analysis of whole blood lysis methods for flow cytometry. Cytometry. 1997;30:124–133. - PubMed
-
- Calabrese R, Valentini E, Ciccarone F, Guastafierro T, Bacalini MG, Ricigliano VA, Zampieri M, Annibali V, Mechelli R, Franceschi C, Salvetti M, Caiafa P. TET2 gene expression and 5-hydroxymethylcytosine level in multiple sclerosis peripheral blood cells. Biochim Biophys Acta. 2014;1842:1130–1136. - PubMed
Publication types
MeSH terms
Substances
Grants and funding
LinkOut - more resources
Full Text Sources
Other Literature Sources
Molecular Biology Databases
Research Materials
