. 2016 Oct:126:33-41.
doi: 10.1016/j.pep.2016.04.016. Epub 2016 May 6.

Cell-free translation and purification of Arabidopsis thaliana regulator of G signaling 1 protein

Affiliations

Cell-free translation and purification of Arabidopsis thaliana regulator of G signaling 1 protein

Bo Li et al. Protein Expr Purif. 2016 Oct.

Abstract

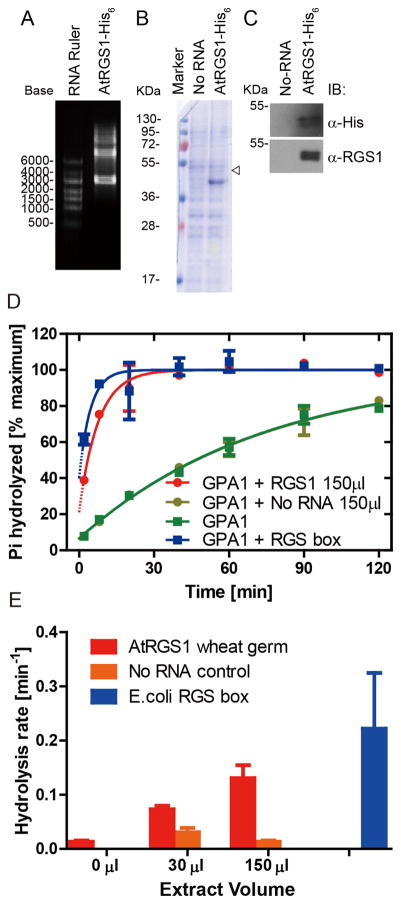
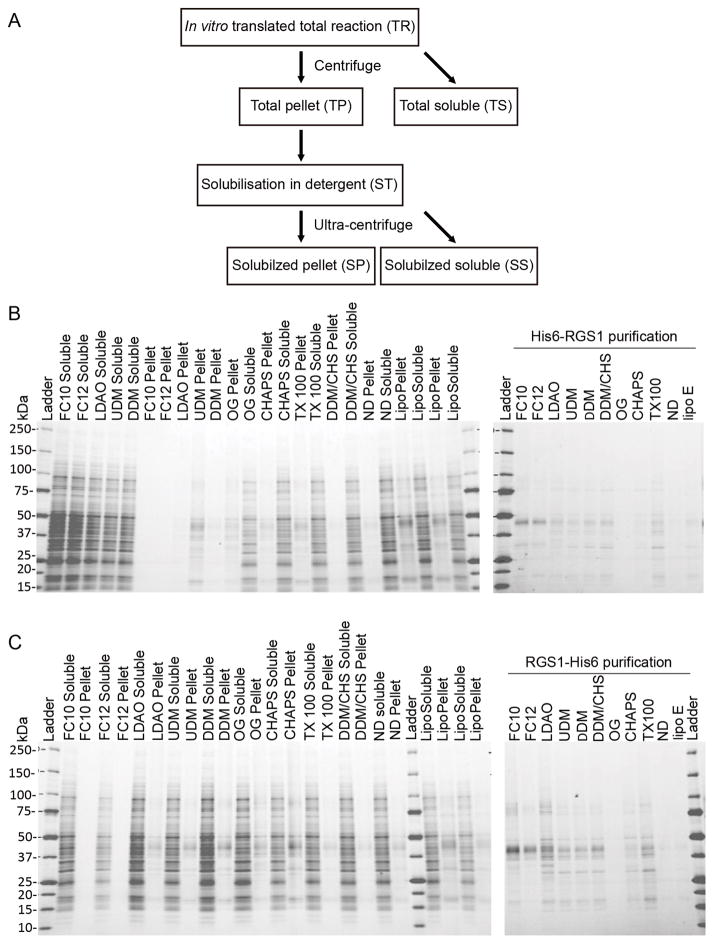
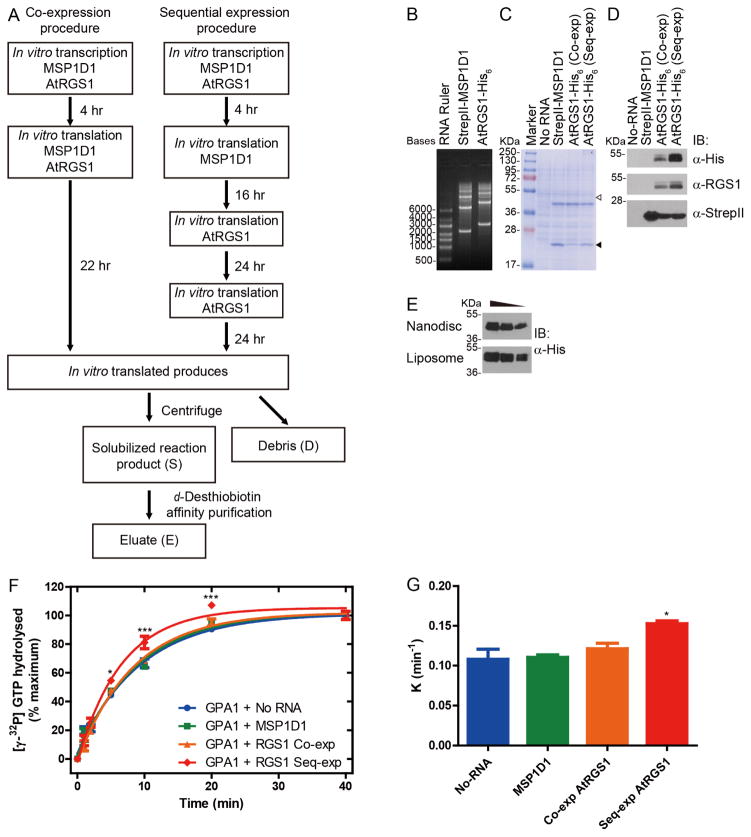
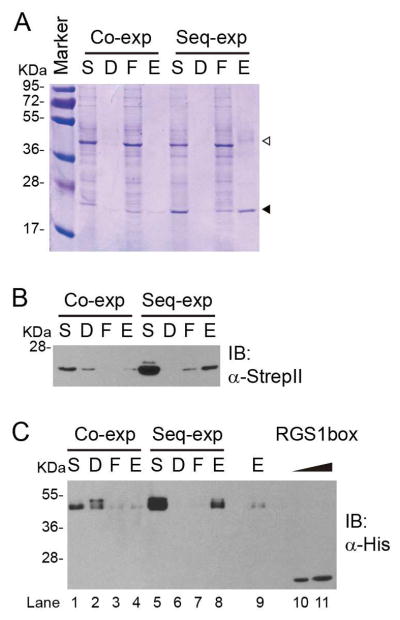
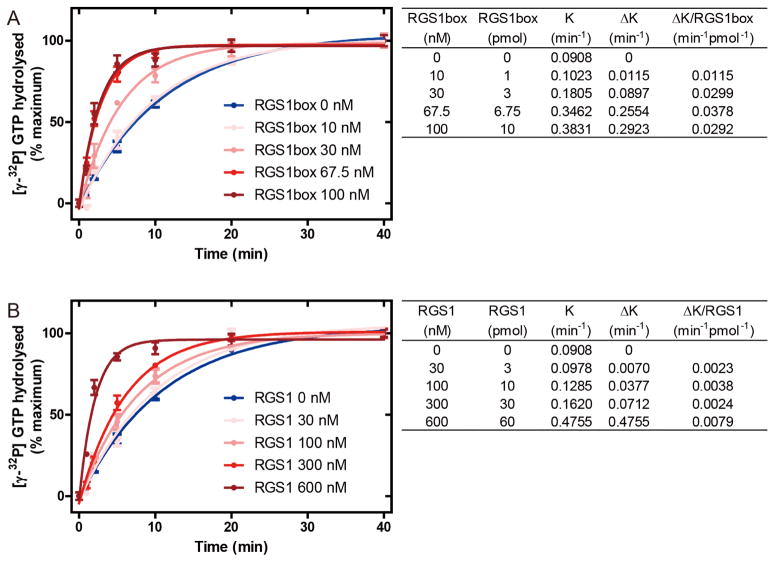
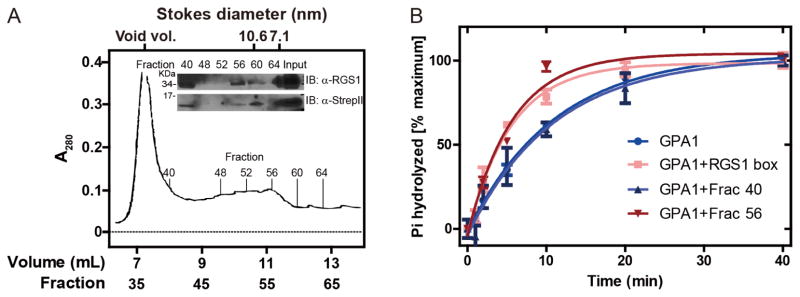
Arabidopsis thaliana Regulator of G protein Signalling 1 (AtRGS1) is a protein with a predicted N-terminal 7-transmembrane (7TM) domain and a C-terminal cytosolic RGS1 box domain. The RGS1 box domain exerts GTPase activation (GAP) activity on Gα (AtGPA1), a component of heterotrimeric G protein signaling in plants. AtRGS1 may perceive an exogenous agonist to regulate the steady-state levels of the active form of AtGPA1. It is uncertain if the full-length AtRGS1 protein exerts any atypical effects on Gα, nor has it been established exactly how AtRGS1 contributes to perception of an extracellular signal and transmits this response to a G-protein dependent signaling cascade. Further studies on full-length AtRGS1 have been inhibited due to the extreme low abundance of the endogenous AtRGS1 protein in plants and lack of a suitable heterologous system to express AtRGS1. Here, we describe methods to produce full-length AtRGS1 by cell-free synthesis into unilamellar liposomes and nanodiscs. The cell-free synthesized AtRGS1 exhibits GTPase activating activity on Gα and can be purified to a level suitable for biochemical analyses.

Keywords: 7-Transmembrane protein; Arabidopsis regulator of G signaling protein 1 (AtRGS1); In vitro translation; Membrane scaffold protein 1D1; Nanodiscs.


Figures

Figure 1
Figure 1. Synthesis of AtRGS1 from wheat germ cell-free extract in the presence of liposomes
(A) In vitro transcription RNA products for AtRGS1- His6 were separated by 1.5% agarose gel. (B and C) Crude extract of in vitro translation for No-RNA control (No-RNA) and AtRGS1-His6 were separated by 12% SDS-PAGE and detected by Coomassie Brilliant Blue Staining (B), and immunoblot analysis with antiserum against the His6 tag (C, upper) or the C-terminal domain containing the RGS box domain (C, lower) antibodies, respectively. The open arrowhead indicates the molecular weight of AtRGS1. (D) 75 μL of AtRGS1 in liposomes were added to 700 μL of reaction mixture on ice. 100 μL of reaction was stopped at 2, 8, 20, 40, 60 and 120 min by ice cold quench buffer. Duplicate time points, except for a single time point at 120 min, were fit with an exponential One-phase association function using GraphPad Prism version 5.0. “No RNA” represents the wheat germ extract containing liposomes. RGS1 box represents 500 nM of truncated AtRGS1 (Lys284 - carboxyl terminus) used as a reference. (E) Hydrolysis rates were estimated from the presented data. Errors are 95% confidence intervals.
Figure 2
Figure 2. Incorporation of AtRGS1 into liposomes
(A) Flow chart detailing the series of centrifugation and solubilization steps to determine incorporation of AtRGS1 into liposomes. Total cell free translation of N-terminal His-tagged AtRGS1 (B) or C-terminal His-tagged AtRGS1 (C), were solubilized in the indicated detergents for 1h at ambient temperature and then centrifuged to separate insoluble and soluble protein (left panels). The soluble fraction of this centrifugation was further purified by using Ni2+ resin in the presence of the solubilization detergent (right panels). The abbreviation and full name of detergents are shown below, followed by their percentage (w/v) used in solubilization and purification: FC10: Fos-choline-10 (2.0, 0.5); FC12: Fos-choline-12 (0.5, 0.05); LDAO: n-dodecyl-N,N-dimethylamine_N-oxide (0.5, 0.05); UDM: n-undecyl-β-D-maltopyranoside (1.0, 0.1); DDM: n-dodecyl-β-D-maltopyranoside (1.0, 0.05); OG: n-octyl-β-D-glucopyranoside (3.0, 1.0); CHAPS: 3-[(3-Cholamidopropyl) dimethylammonio]-1-propanesulfonate (3.0, 0.7); TX-100: polyethylene glycol p-(1,1,3,3-tetramethylbutyl)-phenyl ether (0.05, 0.05); DDM/CHS: DDM/cholesteryl hemi-succinate (1.0/0.2, 0.05/0.01).
Figure 3
Figure 3. Synthesis of MSP1D1 and AtRGS1 from wheat germ cell-free extract
(A) Schematic diagram for two procedures of cell-free synthesis and purification. Co-expression of MSP1D1 with AtRGS1 is compared to sequential expression (Seq-exp) of MSP1D1 followed by AtRGS1. (B) In vitro transcription RNA products for MSP1D1 and AtRGS1 were separated by 1.5% agarose gels. (C and D) Crude extract of in vitro translation for No-RNA negative control (No-RNA), MSP1D1 only (StrepII-MSP1D1), co-expressed AtRGS1 (Co-exp) and sequentially-expressed AtRGS1 (Seq-exp) were separated by 12% SDS-PAGE and detected by Coomassie Brilliant Blue Staining (C), immunoblot analysis using anti- His6 (D, upper), anti-RGS1 (D, middle) and anti-StrepII (D, lower) antibodies. The open and closed arrowheads indicate the predicted molecular weights of AtRGS1 and MSP1D1, respectively. (E) Equal volume of crude AtRGS1 extracts in Nanodisc (sequential synthesis) and liposome were loaded in SDS-PAGE and immunoblotted by anti- His6antibody. The gradient indicates 2 fold dilution between lanes. (F) 250 nM of purified AtGPA1 was pre-incubated with [γ-32P] GTP in ice cold buffer. Single turnover GTPase assays were initiated by the addition of GTPγS containing buffer to crude translation extract of No-RNA, MSP1D1, co-expressed AtRGS1 (Co-exp) or Seq-exp AtRGS1. (G) K value represents the rate constant of the reaction with different crude translation extracts. Duplicated reactions were stopped by ice cold quench buffer at the indicated time points. Data were representative of three or more independent experiments. The data were fit to exponential One-phase association functions using GraphPad Prism version 5.0. The quantitative results were expressed as the means ± S.E.M. of at least three experiments. Statistical significance was determined by an analysis of variance (ANOVA). Differences with P values of <0.05 were considered to be statistically significant.
Figure 4
Figure 4. Isolation of MSP1D1-AtRGS1 complex from crude translation extract
After co-expression or sequential expression, the crude translation extract was fractionated into solubilized reaction product (S) and debris (D) fractions. The solubilized reaction product was incubated with StrepTactin. After discarding the flow-through (F) by centrifugation, StrepII tagged MSP1D1 was eluted by d-desthiobiotin as described in the Materials and Methods. Fractions were isolated by 12% SDS-PAGE and detected by Coomassie Brilliant Blue Staining (A), anti-His (B) and anti-StrepII (C) antibodies. The open and closed arrowheads indicate the predicted molecular weights of AtRGS1 and MSP1D1 respectively. Purified His6tagged RGS1 box (400 ng and 800 ng) was used as the RGS standard (C, lane 10 and 11 respective).
Figure 5
Figure 5. GAP activity of purified MSP1D1-AtRGS1 complex
250 nM of purified AtGPA1 was pre-incubated with [γ-32P] GTP in ice cold buffer. Single turnover GTPase assay were initiated by the addition of GTPγS containing buffer with the indicated concentration of purified RGS1 box (A) or purified sequential expressed AtRGS1 (B). Duplicated reactions were stopped by ice cold quench buffer at the indicated time points. Each experiment was repeated at least once. The data were fit to exponential One-phase association functions using GraphPad Prism version 5.0 and the calculated rates shown in the tables to the right. K value is the rate constant of the reaction. ΔK is the increase caused by RGS1 box or full-length AtRGS1.
Figure 6
Figure 6. Nanodisc-AtRGS1 complex purification by size exclusion chromatography
(A) Elution profile (OD280) of MSP1D1-AtRGS1 complex performed as described in Materials and Methods. Indicated 0.2-mL fractions were subjected to 12% SDS-PAGE and AtRGS1 and MSD1D1 were detected by anti-RGS1 (inset, upper) and anti-StrepII (inset, lower) antibodies, respectively. The input to the column (eluate from affinity purification) was included. The Stokes radii are provided at the top. (B) The GAP activity of indicated fractions was determined by the single turnover GTPase assay. 10 μL of fraction 40, fraction 50 or RGS1box (final concentration 30 nM) was added into each reaction, respectively. Duplicate reactions were stopped by ice cold quench buffer at indicated time points. Data were fit to exponential One-phase association functions using GraphPad Prism version 5.0.

Similar articles

Cited by

References

    1. Lambert NA. Dissociation of heterotrimeric g proteins in cells. Sci Signal. 2008;1:re5. doi: 10.1126/scisignal.125re5. - DOI - PubMed
    1. Zhong H, Wade SM, Woolf PJ, Linderman JJ, Traynor JR, Neubig RR. A spatial focusing model for G protein signals. Regulator of G protein signaling (RGS) protein-mediated kinetic scaffolding. J Biol Chem. 2003;278:7278–84. doi: 10.1074/jbc.M208819200. - DOI - PubMed
    1. Johnston CA, Taylor JP, Gao Y, Kimple AJ, Grigston JC, Chen J-G, et al. GTPase acceleration as the rate-limiting step in Arabidopsis G protein-coupled sugar signaling. Proc Natl Acad Sci U S A. 2007;104:17317–22. doi: 10.1073/pnas.0704751104. - DOI - PMC - PubMed
    1. Urano D, Jones JC, Wang H, Matthews M, Bradford W, Bennetzen JL, et al. G protein activation without a GEF in the plant kingdom. PLoS Genet. 2012;8:e1002756. doi: 10.1371/journal.pgen.1002756. - DOI - PMC - PubMed
    1. Bradford W, Buckholz A, Morton J, Price C, Jones AM, Urano D. Eukaryotic G protein signaling evolved to require G protein-coupled receptors for activation. Sci Signal. 2013;6:ra37. doi: 10.1126/scisignal.2003768. - DOI - PMC - PubMed

Publication types

MeSH terms