. 2016 May 5;17(5):682.
doi: 10.3390/ijms17050682.

Functional and Activity Analysis of Cattle UCP3 Promoter with MRFs-Related Factors

Affiliations

Functional and Activity Analysis of Cattle UCP3 Promoter with MRFs-Related Factors

Wei Chen et al. Int J Mol Sci. .

Abstract

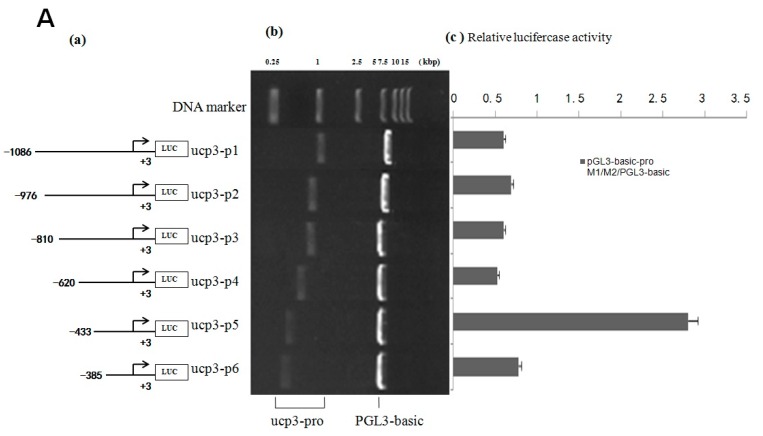
Uncoupling protein 3 (UCP3) is mainly expressed in muscle. It plays an important role in muscle, but less research on the regulation of cattle UCP3 has been performed. In order to elucidate whether cattle UCP3 can be regulated by muscle-related factors, deletion of cattle UCP3 promoter was amplified and cloned into pGL3-basic, pGL3-promoter and PEGFP-N3 vector, respectively, then transfected into C2C12 myoblasts cells and UCP3 promoter activity was measured using the dual-Luciferase reporter assay system. The results showed that there is some negative-regulatory element from -620 to -433 bp, and there is some positive-regulatory element between -433 and -385 bp. The fragment (1.08 kb) of UCP3 promoter was cotransfected with muscle-related transcription factor myogenic regulatory factors (MRFs) and myocyte-specific enhancer factor 2A (MEF2A). We found that UCP3 promoter could be upregulated by Myf5, Myf6 and MyoD and downregulated by MyoG and MEF2A.

Keywords: MRFs family; myocyte-specific enhancer factor 2A (MEF2A); promoter; transcriptional activity; uncoupling protein 3 (UCP3).


Figures

Figure 1
Figure 1
The electrophoretogram of RNA. From1 to 6, the results represent heart tissue, liver tissue, small intestine tissue, longissimus dorsi tissue, hind shin tissue, adipose tissue, respectively.
Figure 2
Figure 2
The 2100 biological analyzer results of RNA. From1 to 6, the results represent heart tissue, liver tissue, small intestine, longissimus dorsi, hind shin, adipose tissue, respectively.
Figure 3
Figure 3
The expressing level of uncoupling protein 3 (ucp3) gene in Guanling cattle different tissues.
Figure 4
Figure 4
Deletion analysis of the cattle UCP3 promoter. (A) Promoter activity of the pGL3-basic-ucp3-Pro in C2C12 Cells; (B) Promoter activity of the pGL3-promoter-ucp3-Pro in C2C12 Cells; (C) Activity of the ucp3 promoter in C2C12 Cells. (a) Schematic diagram of the UCP3 promoter constructs consisting of the 5′-flanking region with serial deletions cloned into the pGL3-basic and pGL3-promoter vector. The arrows show the direction of transcription. The numbers represent the end points of each construct; (b) The deletion plasmids were digested by restriction enzyme and run on a 1.5% agarose gel. The size of the vector is 4.8 kb. The inserted fragments of the UCP3 promoter range from 389 to 1086 bp which are confirmed by sequencing; (c) The deletion plasmids were cotransfected with pGL3-basic and pGL3-promoter into C2C12 cells; the cells were harvested 24 h later after transfection and luciferase activity was measured and expressed in relative luciferase units (RLU). The values represent means ± SE. vector represents pGL3-basic, n = 3, ** p < 0.01, by analysis of variance with one-way ANOVA.
Figure 4
Figure 4
Deletion analysis of the cattle UCP3 promoter. (A) Promoter activity of the pGL3-basic-ucp3-Pro in C2C12 Cells; (B) Promoter activity of the pGL3-promoter-ucp3-Pro in C2C12 Cells; (C) Activity of the ucp3 promoter in C2C12 Cells. (a) Schematic diagram of the UCP3 promoter constructs consisting of the 5′-flanking region with serial deletions cloned into the pGL3-basic and pGL3-promoter vector. The arrows show the direction of transcription. The numbers represent the end points of each construct; (b) The deletion plasmids were digested by restriction enzyme and run on a 1.5% agarose gel. The size of the vector is 4.8 kb. The inserted fragments of the UCP3 promoter range from 389 to 1086 bp which are confirmed by sequencing; (c) The deletion plasmids were cotransfected with pGL3-basic and pGL3-promoter into C2C12 cells; the cells were harvested 24 h later after transfection and luciferase activity was measured and expressed in relative luciferase units (RLU). The values represent means ± SE. vector represents pGL3-basic, n = 3, ** p < 0.01, by analysis of variance with one-way ANOVA.
Figure 5
Figure 5
Analysis of the cattle UCP3 promoter. (A) Analysis of activity of pGL3-basic-ucp3-pro/pGL3-basic and pGL3-promoter-ucp3-pro/pGL3-basic; (B) Analysis of activity of of pGL3-promoter-ucp3-pro/pGL3-basic and pGL3-promoter-ucp3-pro/pGL3-promoter. (a) Schematic diagram of the ucp3 promoter constructs consisting of the 5′-flanking region with serial deletions cloned into the pGL3-basic and pGL3-promoter vector. The arrows show the direction of transcription. The numbers represent the end points of each construct; (b) The deletion plasmids were digested by the restriction enzyme and run on a 1.5% agarose gel. The size of vector is 4.8 kb. The inserted fragments of the ucp3 promoter range from 389 to 1086 bp which are confirmed by sequencing; (c) The deletion plasmids were cotransfected with pGL3-basic and pGL3-promoter into C2C12 cells; the cells were harvested 24 h later after transfection and luciferase activity was measured and expressed in relative luciferase units (RLU).
Figure 6
Figure 6
Identification and analysis of PEGFP-N3-ucp3-pro. (a) Enzyme digestion results of PEGFP-N3-ucp3-pro recombinant plasmid. M represent 15,000 bp marker, from1 to 6, the results represent PEGFP-N3-ucp3-p1–PEGFP-N3-ucp3-p6, respectively; (bh) The green fluorescence of recombinant expression vector PEGFP-N3-ucp3-pro transitional C2C12 cell (Fluorescent inverted microscope ×20).
Figure 7
Figure 7
Transcription factor screening results. (A) The comparison chart of the control group and experimental group processing value of the screened out transcription factors; (B) The comparison chart of the control group and experimental group processing value of some transcription factors.
Figure 7
Figure 7
Transcription factor screening results. (A) The comparison chart of the control group and experimental group processing value of the screened out transcription factors; (B) The comparison chart of the control group and experimental group processing value of some transcription factors.
Figure 8
Figure 8
The effect of transcriptional activity of Guangling Cattle UCP3 promoter by MRFs family and myocyte-specific enhancer factor 2A (MEF2A) in C2C12 myoblasts.C2C12 myoblasts were transfected with the reporter gene constructs, pGL3-basic-ucp3-p1, pGL3-Basic, and the internal control, pcDNA3.1(+)-MRFs family and pcDNA3.1(+)-MEF2A expression vector. After 48 h, the cells were harvested for reporter gene assays. The normalized firefly luciferase activity of the experimental group was compared to that of the control group, which was transfected with an empty expression vector containing no cDNA. The control group (open bar) value was set at 1.0, with the fold induction of each group being determined. The bars represent the means ± SE of triplicate determinations.
Figure 9
Figure 9
Cloned and identified sequence of the cattle UCP3 promoter (a) The electrophoretogram of DNA, the product was run on a 1.5% agarose gel; (b) Different PCR products of UCP3 promoters; (c) Restriction analysis Identification of pUCm-T-ucp3-pro.

Similar articles

Cited by

References

    1. Daniel R., Frederic B. The uncoupling protein homologues: UCP1, UCP2, UCP3, StUCP and AtUCP. Biochem. J. 2000;345:161–179. - PMC - PubMed
    1. Joseph H., Francois C. Evolutionary history of the UCP gene family: Gene duplication and selection. BMC Evol. Biol. 2008;8 doi: 10.1186/1471-2148-8-306. - DOI - PMC - PubMed
    1. Boss O., Samec S., Dulloo A., Seydoux J., Muzzin P., Giacobino J.P. Tissue-dependent upregulation of rat uncoupling protein-2 expression in response to fasting or cold. FEBS Lett. 1997;412:111–114. doi: 10.1016/S0014-5793(97)00755-2. - DOI - PubMed
    1. Boss O., Samec S., Paoloni-Giacobino A., Rossier C., Dulloo A., Seydoux J., Muzzin P., Giacobino J.P. Uncoupling protein-3, a new member of the mitochondrial carrier family with tissue specific expression. FEBS Lett. 1997;408:39–42. doi: 10.1016/S0014-5793(97)00384-0. - DOI - PubMed
    1. Solanes G., Pedraza N., Iglesias R., Giralt M., Villarroya F. Functional Relationship between MyoD and Peroxisome Proliferator-Activated Receptor Dependent Regulatory Pathways in the Control of the Human Uncoupling Protein-3 Gene Transcription. Mol. Endocrinol. 2003;17:1944–1958. doi: 10.1210/me.2002-0395. - DOI - PubMed

MeSH terms

Substances