

Morphometric Analysis of Recognized Genes for Autism Spectrum Disorders and Obesity in Relationship to the Distribution of Protein-Coding Genes on Human Chromosomes
- PMID: 27164088
- PMCID: PMC4881499
- DOI: 10.3390/ijms17050673
Morphometric Analysis of Recognized Genes for Autism Spectrum Disorders and Obesity in Relationship to the Distribution of Protein-Coding Genes on Human Chromosomes
Abstract
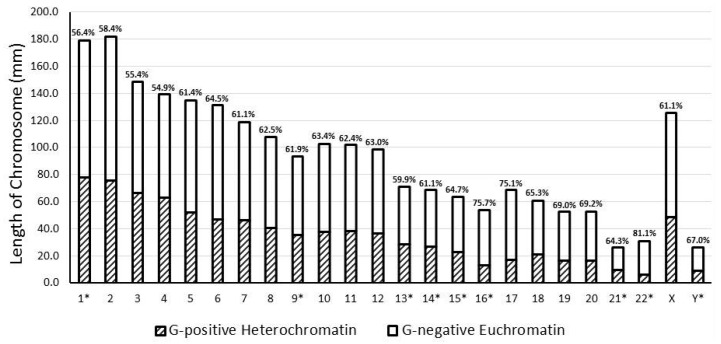
Mammalian chromosomes are comprised of complex chromatin architecture with the specific assembly and configuration of each chromosome influencing gene expression and function in yet undefined ways by varying degrees of heterochromatinization that result in Giemsa (G) negative euchromatic (light) bands and G-positive heterochromatic (dark) bands. We carried out morphometric measurements of high-resolution chromosome ideograms for the first time to characterize the total euchromatic and heterochromatic chromosome band length, distribution and localization of 20,145 known protein-coding genes, 790 recognized autism spectrum disorder (ASD) genes and 365 obesity genes. The individual lengths of G-negative euchromatin and G-positive heterochromatin chromosome bands were measured in millimeters and recorded from scaled and stacked digital images of 850-band high-resolution ideograms supplied by the International Society of Chromosome Nomenclature (ISCN) 2013. Our overall measurements followed established banding patterns based on chromosome size. G-negative euchromatic band regions contained 60% of protein-coding genes while the remaining 40% were distributed across the four heterochromatic dark band sub-types. ASD genes were disproportionately overrepresented in the darker heterochromatic sub-bands, while the obesity gene distribution pattern did not significantly differ from protein-coding genes. Our study supports recent trends implicating genes located in heterochromatin regions playing a role in biological processes including neurodevelopment and function, specifically genes associated with ASD.
Keywords: G-negative euchromatin; G-positive heterochromatin; autism spectrum disorder (ASD) genes; chromosome organization; high-resolution chromosome ideograms; obesity genes; protein-coding genes.
Figures


Similar articles
-
Quantitative analysis of high-resolution trypsin-giemsa bands on human prometaphase chromosomes.Hum Genet. 1978 Dec 18;45(2):137-65. doi: 10.1007/BF00286957. Hum Genet. 1978. PMID: 738718
-
Sequential staining of euchromatic and heterochromatic regions of the human Y chromosome.J Med Genet. 1980 Dec;17(6):468-71. doi: 10.1136/jmg.17.6.468. J Med Genet. 1980. PMID: 7205430 Free PMC article.
-
The nature of G-bands analyzed by chromosome stretching.Cytogenet Cell Genet. 1997;79(1-2):162-6. doi: 10.1159/000134710. Cytogenet Cell Genet. 1997. PMID: 9533040
-
Cytogenetic nomenclature of deer mice, Peromyscus (Rodentia): revision and review of the standardized karyotype. Report of the Committee for the Standardization of Chromosomes of Peromyscus.Cytogenet Cell Genet. 1994;66(3):181-95. doi: 10.1159/000133696. Cytogenet Cell Genet. 1994. PMID: 8125018 Review.
-
Evolution of chromosome bands: molecular ecology of noncoding DNA.J Mol Evol. 1989 Jun;28(6):469-86. doi: 10.1007/BF02602928. J Mol Evol. 1989. PMID: 2549255 Review.
Cited by
-
The Autism Spectrum: Behavioral, Psychiatric and Genetic Associations.Genes (Basel). 2023 Mar 9;14(3):677. doi: 10.3390/genes14030677. Genes (Basel). 2023. PMID: 36980949 Free PMC article. Review.
-
Molecular genetic classification in Prader-Willi syndrome: a multisite cohort study.J Med Genet. 2019 Mar;56(3):149-153. doi: 10.1136/jmedgenet-2018-105301. Epub 2018 May 5. J Med Genet. 2019. PMID: 29730598 Free PMC article.
-
Transcripts derived from AmnSINE1 repetitive sequences are depleted in the cortex of autism spectrum disorder patients.Front Bioinform. 2025 Apr 9;5:1532981. doi: 10.3389/fbinf.2025.1532981. eCollection 2025. Front Bioinform. 2025. PMID: 40270680 Free PMC article.
-
Sex differences in the late first trimester human placenta transcriptome.Biol Sex Differ. 2018 Jan 15;9(1):4. doi: 10.1186/s13293-018-0165-y. Biol Sex Differ. 2018. PMID: 29335024 Free PMC article.
References
-
- Zhang Y., Máté G., Müller P., Hillebrandt S., Krufczik M., Bach M., Kaufmann R., Hausmann M., Heermann D.W. Radiation induced chromatin conformation changes analysed by fluorescent localization microscopy, statistical physics, and graph theory. PLoS ONE. 2015;10:673. doi: 10.1371/journal.pone.0128555. - DOI - PMC - PubMed
-
- Annunziato A. DNA packaging: Nucleosomes and chromatin. Nat. Educ. 2008;1:26.
-
- Murakami Y. Heterochromatin and Euchromatin. In: Dubitzky W., Wolkenhauer O., Yokota H., Cho K., Yokota H., editors. Encyclopedia of Systems Biology. Springer; New York, NY, USA: 2013. pp. 881–884.
MeSH terms
Substances
Grants and funding
LinkOut - more resources
Full Text Sources
Other Literature Sources
Medical
