. 2016 May 6;17(5):686.
doi: 10.3390/ijms17050686.

Spatial Geometries of Self-Assembled Chitohexaose Monolayers Regulate Myoblast Fusion

Affiliations

Spatial Geometries of Self-Assembled Chitohexaose Monolayers Regulate Myoblast Fusion

Pornthida Poosala et al. Int J Mol Sci. .

Abstract

Myoblast fusion into functionally-distinct myotubes to form in vitro skeletal muscle constructs under differentiation serum-free conditions still remains a challenge. Herein, we report that our microtopographical carbohydrate substrates composed of bioactive hexa-N-acetyl-d-glucosamine (GlcNAc6) modulated the efficiency of myoblast fusion without requiring horse serum or any differentiation medium during cell culture. Promotion of the differentiation of dissociated mononucleated skeletal myoblasts (C2C12; a mouse myoblast cell line) into robust myotubes was found only on GlcNAc6 micropatterns, whereas the myoblasts on control, non-patterned GlcNAc6 substrates or GlcNAc6-free patterns exhibited an undifferentiated form. We also examined the possible role of GlcNAc6 micropatterns with various widths in the behavior of C2C12 cells in early and late stages of myogenesis through mRNA expression of myosin heavy chain (MyHC) isoforms. The spontaneous contraction of myotubes was investigated via the regulation of glucose transporter type 4 (GLUT4), which is involved in stimulating glucose uptake during cellular contraction. Narrow patterns demonstrated enhanced glucose uptake rate and generated a fast-twitch muscle fiber type, whereas the slow-twitch muscle fiber type was dominant on wider patterns. Our findings indicated that GlcNAc6-mediated integrin interactions are responsible for guiding myoblast fusion forward along with myotube formation.

Keywords: GLUT4; cell fusion; chitohexaose; glucose uptake; micropattern; myoblast; myosin heavy chain; skeletal muscle.


Figures

Figure 1
Figure 1
Schematic illustration of differentiation behavior and myoblast fusion on microscale topographical patterns of hexa-N-acetyl-d-glucosamine (GlcNAc6)-self-assembled monolayers (SAMs) and GlcNAc6-free substrates, directing myotube formation and the possible cellular signaling machinery involved in gene regulation and contraction-stimulated glucose uptake through a specific GlcNAc6–receptor interaction on cell surfaces, which denoted in a dashed black box. The main signaling pathways for possible regulation through GlcNAc6 oligomers interacting with glyco-receptor proteins in myoblasts (thick arrows) and the convergence of unknown signaling pathways that induce myoblast fusion (dashed arrows) are depicted. Scale bars represent 200 µm.
Figure 1
Figure 1
Schematic illustration of differentiation behavior and myoblast fusion on microscale topographical patterns of hexa-N-acetyl-d-glucosamine (GlcNAc6)-self-assembled monolayers (SAMs) and GlcNAc6-free substrates, directing myotube formation and the possible cellular signaling machinery involved in gene regulation and contraction-stimulated glucose uptake through a specific GlcNAc6–receptor interaction on cell surfaces, which denoted in a dashed black box. The main signaling pathways for possible regulation through GlcNAc6 oligomers interacting with glyco-receptor proteins in myoblasts (thick arrows) and the convergence of unknown signaling pathways that induce myoblast fusion (dashed arrows) are depicted. Scale bars represent 200 µm.
Figure 2
Figure 2
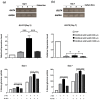
Effects of micropatterns and non-patterns with or without GlcNAc6-SAMs on differentiated C2C12 cells during myotube development. (a) Myoblast differentiation proceeds in stages from Days 3–7 under culture medium without switching to differentiation medium on the GlcNAc6-SAM pattern (1000 µm); (b) Confocal images of differentiated myoblasts on the GlcNAc6-SAM pattern (500 µm). Actin filaments were stained green, and nuclei were visualized with DAPI (blue) after seven days of culture. Myotubes are labeled with white arrows. Scale bars represent 200 µm (ce). mRNA expression levels of GLUT4 and three isoforms of myosin heavy chains (MyHCs) in myoblasts after seven days of culture. The expression level was normalized to GAPDH and β-actin for GLUT4 and MyHCs, respectively. Representative polymerase chain reaction (PCR) products of target genes were determined on 2% agarose gels by ethidium bromide staining. Lane 1: tissue culture polystyrene (TCPS); Lane 2: GlcNAc6-free non-pattern; Lane 3: GlcNAc6-SAM non-pattern; Lane 4: GlcNAc6-free pattern (500 µm); and Lane 5: GlcNAc6-SAM pattern (500 µm). Asterisks signify a significant difference from the appropriate control value. Values are the mean ± SEM, n = 9 per each sample; * p < 0.05, ** p < 0.01, *** p < 0.001 and **** p < 0.0001.
Figure 2
Figure 2
Effects of micropatterns and non-patterns with or without GlcNAc6-SAMs on differentiated C2C12 cells during myotube development. (a) Myoblast differentiation proceeds in stages from Days 3–7 under culture medium without switching to differentiation medium on the GlcNAc6-SAM pattern (1000 µm); (b) Confocal images of differentiated myoblasts on the GlcNAc6-SAM pattern (500 µm). Actin filaments were stained green, and nuclei were visualized with DAPI (blue) after seven days of culture. Myotubes are labeled with white arrows. Scale bars represent 200 µm (ce). mRNA expression levels of GLUT4 and three isoforms of myosin heavy chains (MyHCs) in myoblasts after seven days of culture. The expression level was normalized to GAPDH and β-actin for GLUT4 and MyHCs, respectively. Representative polymerase chain reaction (PCR) products of target genes were determined on 2% agarose gels by ethidium bromide staining. Lane 1: tissue culture polystyrene (TCPS); Lane 2: GlcNAc6-free non-pattern; Lane 3: GlcNAc6-SAM non-pattern; Lane 4: GlcNAc6-free pattern (500 µm); and Lane 5: GlcNAc6-SAM pattern (500 µm). Asterisks signify a significant difference from the appropriate control value. Values are the mean ± SEM, n = 9 per each sample; * p < 0.05, ** p < 0.01, *** p < 0.001 and **** p < 0.0001.
Figure 3
Figure 3
Micropatterned GlcNAc6-SAMs induce GLUT4 mRNA expression in differentiated C2C12 cells through contraction-dependent glucose uptake. Myoblasts were stimulated with (+) or without (−) 1 µM insulin, and glucose uptake rates were measured. Data were obtained after (a) five days and (b) seven days. Results are presented as the mean ± standard error of the mean (SEM) from triplicate measurements and are representative of three independent experiments. Lane 1: tissue culture polystyrene (TCPS); Lane 2: GlcNAc6-SAM pattern (200 µm); Lane 3: GlcNAc6-SAM pattern (500 µm); Lane 4: GlcNAc6-SAM pattern (1000 µm). Values were analyzed by the t-test, * p < 0.05, *** p < 0.001 and **** p < 0.0001.
Figure 4
Figure 4
Effects of micropatterned GlcNAc6-SAMs on myosin heavy chain (MyHC) expression in differentiated C2C12 cells at different culture time points in a differentiation serum-free medium. (a) Representative quantitative real-time PCR products of MyHCs. The mRNA levels were normalized to β-actin. Lane 1: tissue culture polystyrene (TCPS); Lane 2: GlcNAc6-SAM pattern (200 µm); Lane 3: GlcNAc6-SAM pattern (500 µm); Lane 4: GlcNAc6-SAM pattern (1000 µm); (b) Immunocytochemical staining of MyHCs on narrow patterns and control TCPS substrate in the absence and presence of differentiation serum media, respectively. Myoblast fusion and myotube formation were found on GlcNAc6-SAM patterns after Day 5 and 7 of culture, respectively. A close-up image of multinucleated myotubes is shown in the inset panel. At Day 7, myotubes formed on the GlcNAc6-SAM patterns under differentiation serum-free conditions demonstrated long and thin morphology when compared to those on the TCPS substrate under differentiation serum-containing conditions, which promoted the formation of thicker myotubes with numerous branched structures. Shown are confocal images of differentiated cells stained with anti-MyHC antibody to monitor myotube formation (red). DAPI was used to visualize nuclei (blue). Scale bars represent 200 µm; (ce) Individual MyHC mRNA expression profiles on various geometries. Values are the mean ± SEM, n = 9 per each sample. * p < 0.05, ** p < 0.01, *** p < 0.001 and **** p < 0.0001.
Figure 4
Figure 4
Effects of micropatterned GlcNAc6-SAMs on myosin heavy chain (MyHC) expression in differentiated C2C12 cells at different culture time points in a differentiation serum-free medium. (a) Representative quantitative real-time PCR products of MyHCs. The mRNA levels were normalized to β-actin. Lane 1: tissue culture polystyrene (TCPS); Lane 2: GlcNAc6-SAM pattern (200 µm); Lane 3: GlcNAc6-SAM pattern (500 µm); Lane 4: GlcNAc6-SAM pattern (1000 µm); (b) Immunocytochemical staining of MyHCs on narrow patterns and control TCPS substrate in the absence and presence of differentiation serum media, respectively. Myoblast fusion and myotube formation were found on GlcNAc6-SAM patterns after Day 5 and 7 of culture, respectively. A close-up image of multinucleated myotubes is shown in the inset panel. At Day 7, myotubes formed on the GlcNAc6-SAM patterns under differentiation serum-free conditions demonstrated long and thin morphology when compared to those on the TCPS substrate under differentiation serum-containing conditions, which promoted the formation of thicker myotubes with numerous branched structures. Shown are confocal images of differentiated cells stained with anti-MyHC antibody to monitor myotube formation (red). DAPI was used to visualize nuclei (blue). Scale bars represent 200 µm; (ce) Individual MyHC mRNA expression profiles on various geometries. Values are the mean ± SEM, n = 9 per each sample. * p < 0.05, ** p < 0.01, *** p < 0.001 and **** p < 0.0001.

Similar articles

References

    1. Hindi S.M., Tajrishi M.M., Kumar A. Signaling mechanisms in mammalian myoblast fusion. Sci. Signal. 2013;6:re2. doi: 10.1126/scisignal.2003832. - DOI - PMC - PubMed
    1. Kim J.H., Jin P., Duan R., Chen E.H. Mechanisms of myoblast fusion during muscle development. Curr. Opin. Genet. Dev. 2015;32:162–170. doi: 10.1016/j.gde.2015.03.006. - DOI - PMC - PubMed
    1. Luo W., Li E., Nie Q., Zhang X. Myomaker, regulated by MYOD, MYOG and miR-140-3P, promotes chicken myoblast fusion. Int. J. Mol. Sci. 2015;16:26186–26201. doi: 10.3390/ijms161125946. - DOI - PMC - PubMed
    1. Rochlin K., Yu S., Roy S., Baylies M.K. Myoblast fusion: When it takes more to make one. Dev. Biol. 2010;341:66–83. doi: 10.1016/j.ydbio.2009.10.024. - DOI - PMC - PubMed
    1. Stern-Straeter J., Bran G., Riedel F., Sauter A., Hörmann K., Goessler U.R. Characterization of human myoblast cultures for tissue engineering. Int. J. Mol. Med. 2008;21:49–56. doi: 10.3892/ijmm.21.1.49. - DOI - PubMed

LinkOut - more resources