. 2016 Jul;30(7):709-32.
doi: 10.1210/me.2015-1311. Epub 2016 May 10.

Changes in Gene Expression and Estrogen Receptor Cistrome in Mouse Liver Upon Acute E2 Treatment

Affiliations

Changes in Gene Expression and Estrogen Receptor Cistrome in Mouse Liver Upon Acute E2 Treatment

Gaëlle Palierne et al. Mol Endocrinol. 2016 Jul.

Abstract

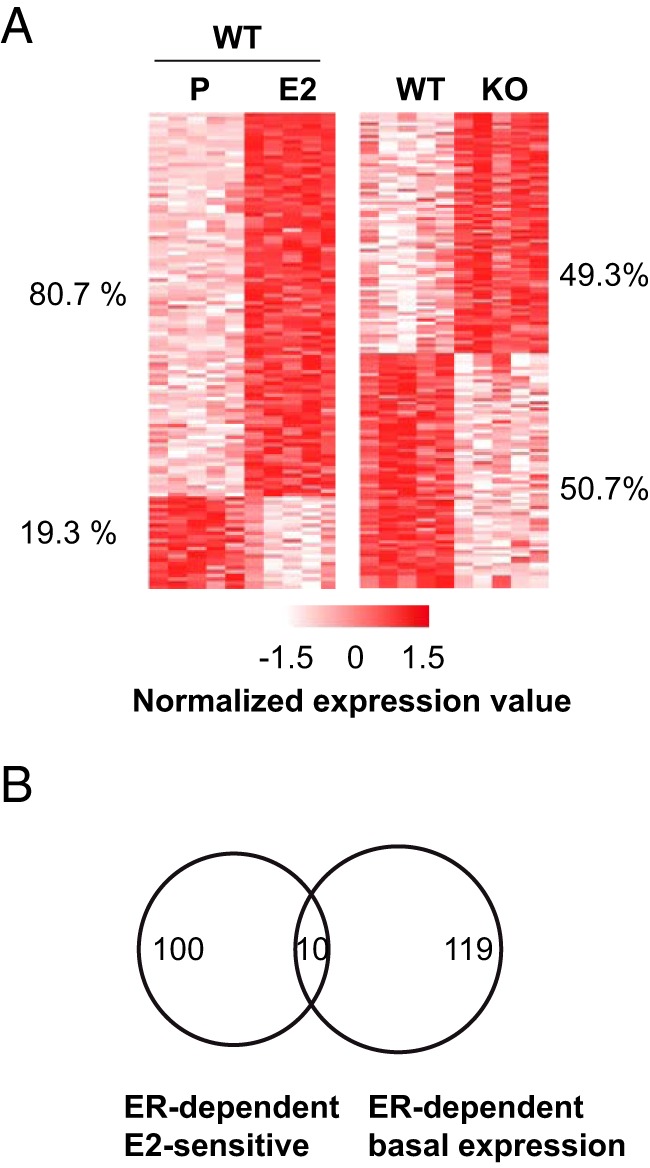
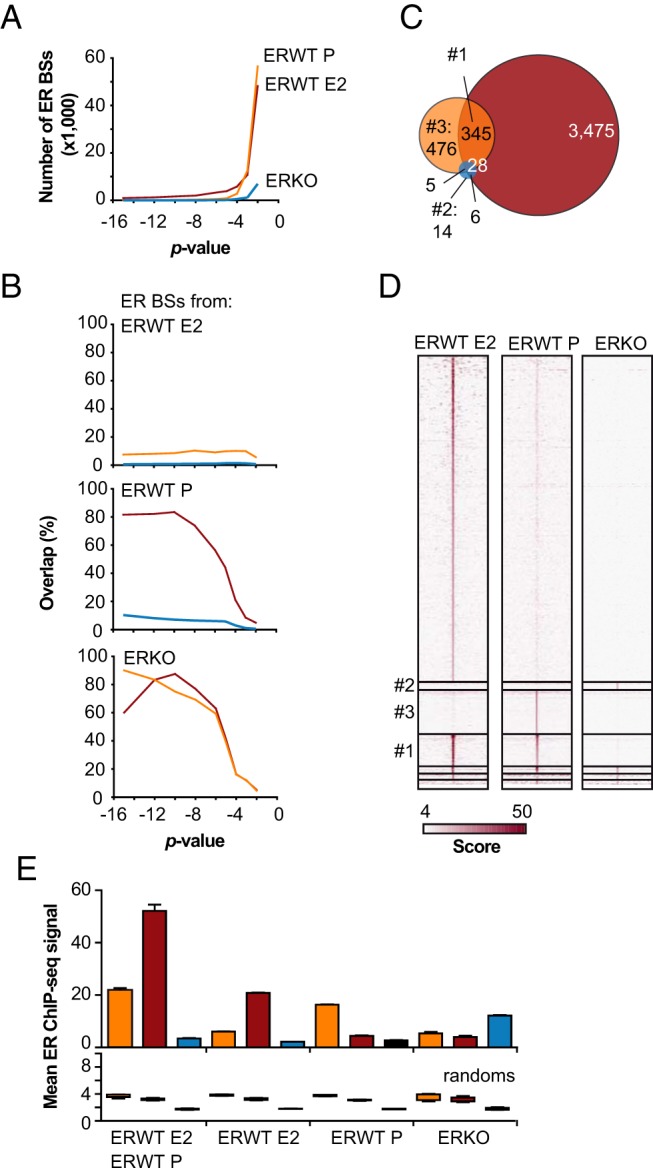
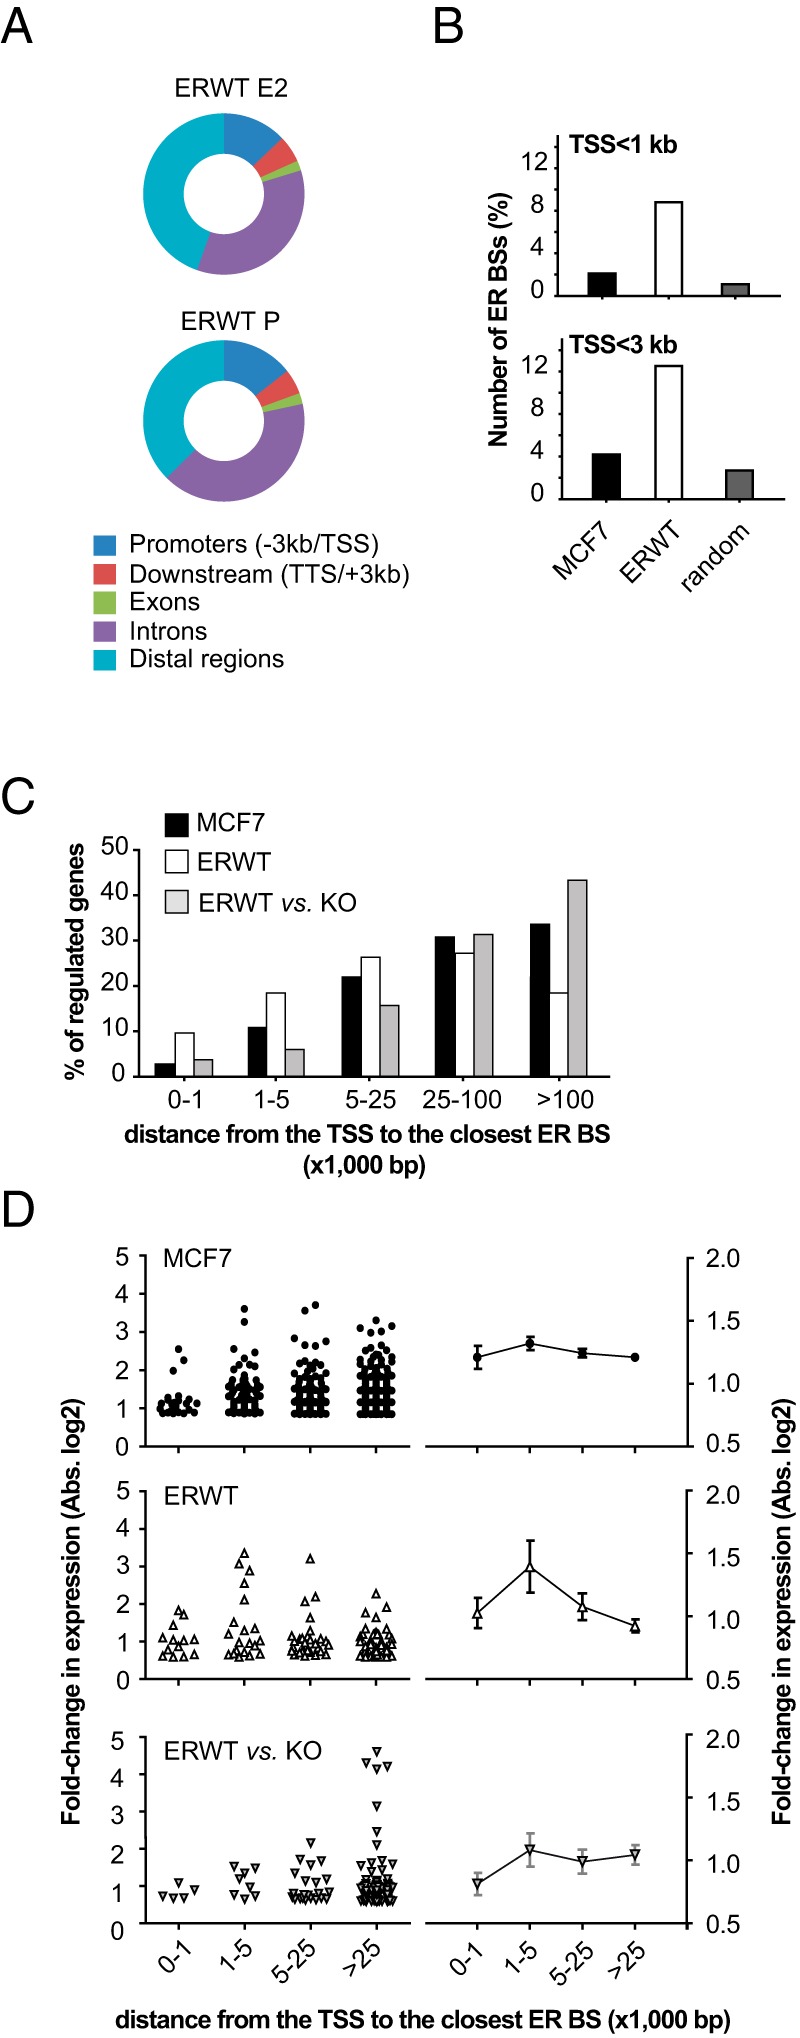
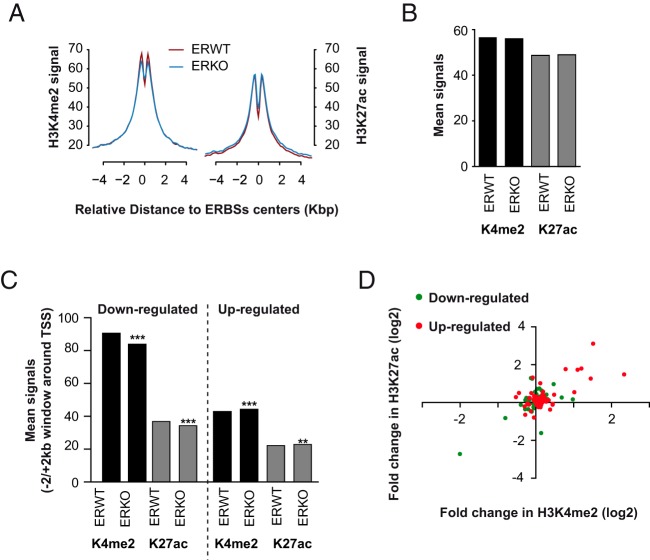
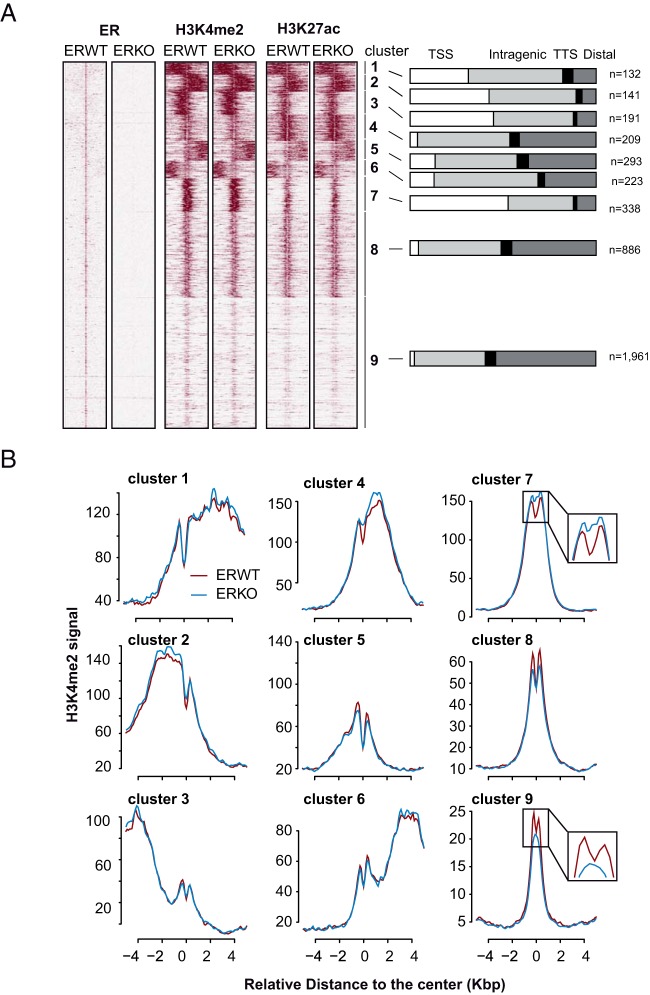
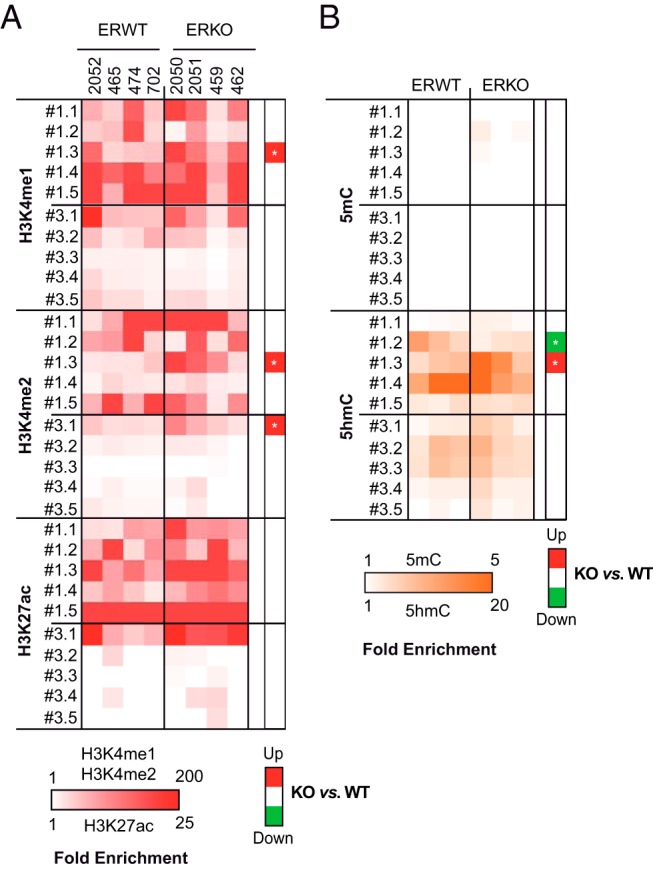
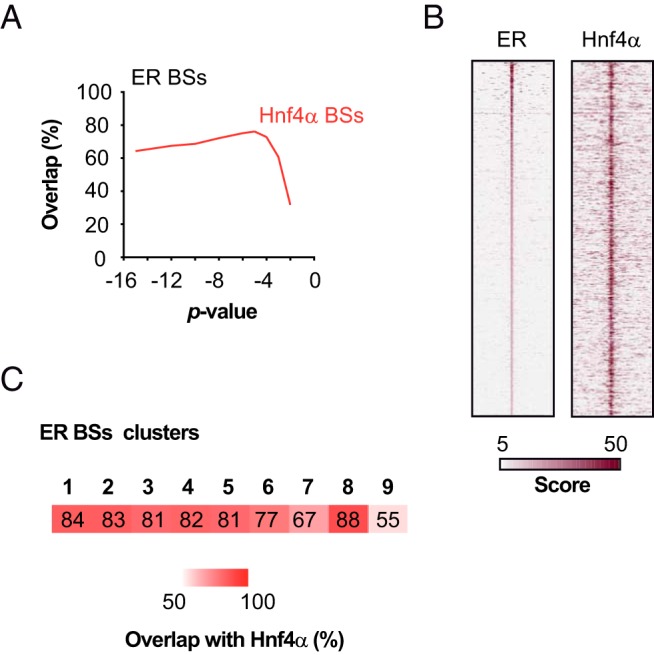
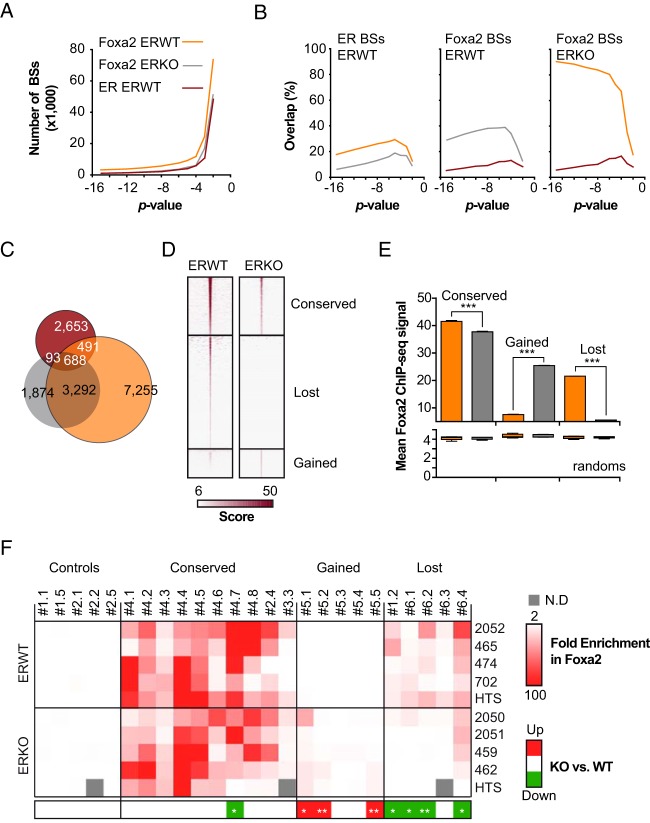
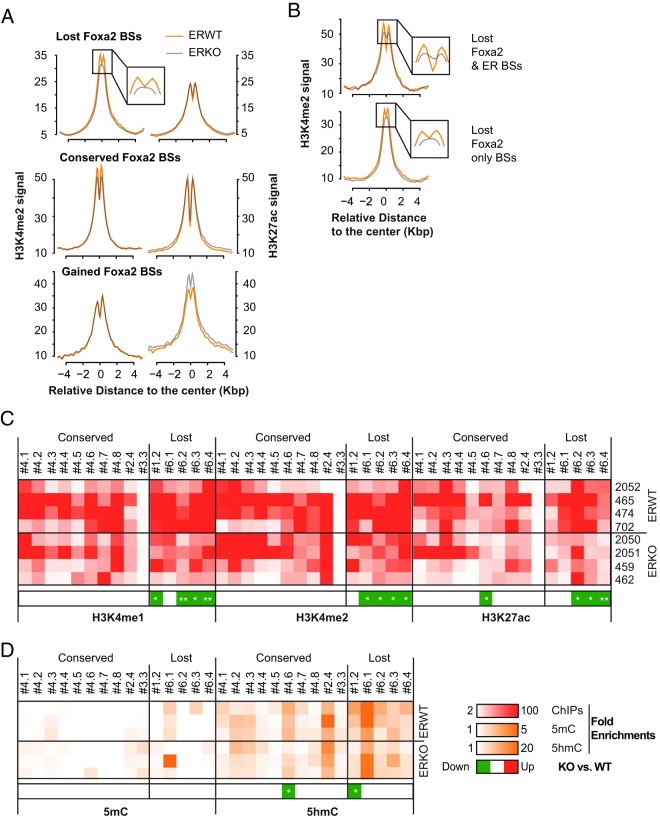
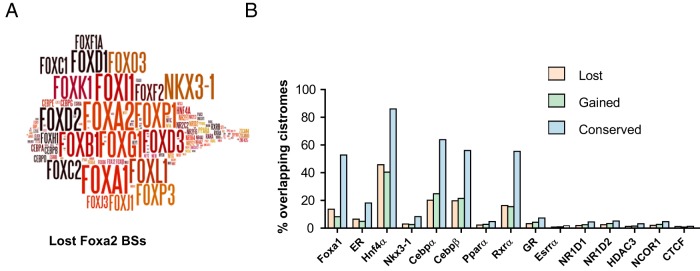
Transcriptional regulation by the estrogen receptor-α (ER) has been investigated mainly in breast cancer cell lines, but estrogens such as 17β-estradiol (E2) exert numerous extrareproductive effects, particularly in the liver, where E2 exhibits both protective metabolic and deleterious thrombotic actions. To analyze the direct and early transcriptional effects of estrogens in the liver, we determined the E2-sensitive transcriptome and ER cistrome in mice after acute administration of E2 or placebo. These analyses revealed the early induction of genes involved in lipid metabolism, which fits with the crucial role of ER in the prevention of liver steatosis. Characterization of the chromatin state of ER binding sites (BSs) in mice expressing or not ER demonstrated that ER is not required per se for the establishment and/or maintenance of chromatin modifications at the majority of its BSs. This is presumably a consequence of a strong overlap between ER and hepatocyte nuclear factor 4α BSs. In contrast, 40% of the BSs of the pioneer factor forkhead box protein a (Foxa2) were dependent upon ER expression, and ER expression also affected the distribution of nucleosomes harboring dimethylated lysine 4 of Histone H3 around Foxa2 BSs. We finally show that, in addition to a network of liver-specific transcription factors including CCAAT/enhancer-binding protein and hepatocyte nuclear factor 4α, ER might be required for proper Foxa2 function in this tissue.


Figures

Figure 1.
Figure 1.. Characterization of the E2-dependent genes in livers from ERWT and ERKO mice.
A, Heatmap illustrating the mean expression values determined for E2-sensitive genes (left side) in P- and E2-treated ERWT animals or for genes whose expression was different between P-treated ERWT and ERKO mice (right side). Each column corresponds to data obtained for 1 animal. For the sake of clarity, expression values for each gene were normalized by the mean and SD. The percentages of up- and down-regulated genes are indicated on the sides of each heatmap. B, Venn diagram depicting the overlap between genes regulated by E2 in ERWT livers and genes whose expression differed between ERWT and ERKO mice.
Figure 2.
Figure 2.. Characterization of the ER cistrome in mouse liver.
A, ER ChIP-seq experiments were performed on chromatin prepared from P- or E2-treated ERWT and ERKO livers. We systematically used different P values at the peak-calling step to determine the ER cistrome under the different conditions. This panel represents the number of identified ER BSs as a function of the P values used. The color code used in A is the same for the next ones. B, Overlap of the different ER cistromes obtained at diverse P values. C, Venn diagram illustrating the common and specific ER BSs using ER cistromes determined at P = 10−5. D, Heatmap representation of the ChIP-seq signal aligned to the center of ER BSs clustered depending on their overlap determined in C. E, Mean ER ChIP-seq signals obtained in ERWT or ERKO mouse livers at the 150 center base pairs of the BSs categories indicated beneath the graph. The upper histogram shows mean values ± SD measured on the sites of interest, whereas the bottom graph shows mean values ± SD of 10 trials carried out on 10 different sets of a corresponding number of random sites.
Figure 3.
Figure 3.. Validation of ER BSs.
A and B, ER ChIP-qPCR experiments were performed on livers from independent animals (numbers on the top of the panel) to validate ChIP-seq data. A, A fraction of the pool of DNA that was subjected to HTS was used as a control. We used 2 panels of antibody: one directed against the C-terminal region of ER (A and B, left side) and the other targeting the N-terminal domain of the protein (A and B, right side). The mobilization of ER was evaluated on a series of genomic regions representing clusters of ER BSs engaged by ER in the presence of E2 or not (#1) or BSs specific for ERKO (#2) or ERWT P (#3) conditions. The results of these experiments are illustrated as a heatmap of values normalized to those of the promoter of the Rplp0 gene, which is an ER-negative region. We also used additional negative and positive controls, located nearby the E2-sensitive Gdf15 gene: Gdf15.2 and Gdf15.3, respectively. B, Results of the experiments were hierarchically clustered to improve the clarity of the heatmap. The distance metric expressed as Pearson correlation is indicated on the right side of the panel. N.D, not determined.
Figure 4.
Figure 4.. Specific features of the ER cistrome in mouse liver.
A, Distribution of ER BSs determined in E2- or P-treated ERWT mouse liver towards annotated gene promoters and TTSs, exons and introns, and intergenic (distal) regions. B, Number of ER BSs located within a 1- or 3-kb window around the TSS of annotated genes in ERWT (P+E2) mouse liver when compared with ER binding data obtained in human breast cancer MCF-7 cells. Calculations were also made using an equivalent number of random regions with similar characteristics than the test ER cistrome determined in ERWT livers. C, Bar chart summarizing the distribution of distances separating E2-regulated genes in breast cancer cell lines or in ERWT mice liver or ER-dependent genes from their closest ER BS. Results are expressed as the percentage of the total population of genes considered. D, Fold changes in gene expression by E2 in MCF-7 and ERWT mouse liver and in ERKO vs ERWT liver are expressed as a function of their proximity to an ER BS. Distribution of values are depicted within the left part of the panel, whereas means ± SD are plotted on the right side of the panel.
Figure 5.
Figure 5.. Coordinated changes in H3K4me2 and H3K27ac levels at promoters of ER-dependent genes.
A, Alignment of H3K4me2 and H3K27ac ChIP-seq signals generated from chromatin prepared from E2-treated livers of ERWT (red line) or ERKO (blue line) mice on a −5-kb/+5-kb window around the center of the ER BSs. B and C, Mean H3K4me2 and H3K27ac ChIP-seq signals at a −500/+500-bp window around the center of ER BSs (B) or within a 4-kb window centered around the TSS of genes with lower or higher expression in ERKO livers (down- or up-regulated, respectively). D, The fold change of mean H3K27 values calculated for each of the promoters of down- or up-regulated genes in ERKO livers are plotted against variations of mean H3K4me2 signals. Values shown are expressed as the log2 of the fold changes.
Figure 6.
Figure 6.. Affected profile of H3K4me2 enrichment of a fraction of ER BSs in ERKO livers.
A, Heatmap representation of a k-mean clusterization of H3K4me2 and H3K27ac ChIP-seq signals obtained in ERWT and ERKO mice livers on ERWT ER BSs. The distribution of clustered ER BSs towards annotated genes' transcriptional start and termination sites (TSS and TTS, respectively), intragenic and intergenic (distal) regions, is indicated on the right side of each clusters, as well as the numbers of genomic sites within each cluster. B, Alignments of H3K4me2 and H3K27ac ChIP-seq mean signals within a −5k-bp/+5-kb window centered on ER BSs of each clusters as defined from the k-mean analysis. Signals obtained in E2-treated livers of ERWT or ERKO mice are illustrated as a red or blue line, respectively. Insets represent magnified views of the center of the graphs and illustrate the observed shift from biphasic to monophasic curves of enrichment in H3K4me2.
Figure 7.
Figure 7.. Chromatin status of ER BSs in ERWT and ERKO mouse livers.
A, Independent anti-H3K4me1, H3K4me2, and H3K27ac ChIP-qPCR experiments were performed to validate ChIP-seq data. The presence of these marks on ER BSs from series #1 and #3, as defined in Figure 3, is depicted within the illustrated heatmaps. Numbers on the top refer to the animals from which the chromatin preparations originated. Experiments were done twice per individual. Mean enrichment values calculated per individual are shown as normalized to a control negative ChIP experiment using the same chromatin samples. B, Heatmap illustrating the mean enrichment of indicated ER BSs in 5mC and 5hmC as tested by MeDIP- and hMeDIP-qPCR experiments, respectively. The values included within these graphs were obtained from 3 independent experiments performed on 2 different DNA samples originating from 2 different ERWT or ERKO animals. Data were normalized to values obtained using an internal negative control devoid of CpGs. Significant reduced (green) or gained (red) enrichment in histone marks or DNA modifications ERKO livers are indicated in the heatmaps on the right side of each panels. Calculated P values from Mann-Whitney t tests are indicated within the heatmap as follows: *, P < .05; **, P < .01.
Figure 8.
Figure 8.. Overlap of ER and Hnf4α cistromes.
A, Overlap of the ER BSs determined in E2-treated ERWT livers with those of Hnf4α obtained at diverse P values. B, Heatmap representation of ER and Hnf4α ChIP-seq signals within a −5-kb/+5-kb window centered on ER BSs. Regions are sorted by their rank in ER ChIP-seq signal. C, Heatmap representing the overlap between the clusters of ER BSs as determined in Figure 6 with Hnf4α BSs determined at P = 10−5. The numbers indicated represent the calculated overlaps.
Figure 9.
Figure 9.. The Foxa2 cistrome is partially ER dependent.
A, Foxa2 ChIP-seq experiments were performed on chromatin prepared from E2-treated ERWT and ERKO livers. As carried out previously, we systematically used different thresholds to determine the number of Foxa2 BSs in each of the experimental conditions (orange and gray lines for ERWT and ERKO animals, respectively). The number of ER BSs in ERWT (red curve) is given as reference. The color code used in A is the same for the next ones. B, Overlap of the different Foxa2 cistromes at diverse P values with ER BSs or Foxa2 BSs determined in E2-treated ERWT livers (left and middle graphs), or Foxa2 BSs in E2-treated ERKO livers (right). C, Venn diagram illustrating the overlap of ER BSs with Foxa2 BSs in ERWT or ERKO mice at the chosen P = 10−4. D, Heatmap of Foxa2 normalized ChIP-seq signals obtained from ERWT or ERKO chromatin on conserved, lost, or gained Foxa2 BSs. E, Mean Foxa2 ChIP-seq signals obtained in ERWT or ERKO mouse livers (orange or gray bars, respectively) at the 150 center base pairs of Foxa2 BSs. The upper histogram shows mean values ± SD measured for conserved, gained, or lost sites. Calculations were also carried out for 10 different sets of a corresponding number of random sites. Means ± SD of these 10 random trials are illustrated within the bottom histogram. F, Anti-Foxa2 ChIP-qPCR experiments were performed on 4 liver chromatin samples originating from independent E2-treated ERWT or ERKO mice. A fraction of the pooled DNA sample that was subjected to HTS was also evaluated in parallel. The upper heatmap shows the values obtained on indicated tested genomic regions normalized to those obtained from a nonspecific control (promoter of the Rplp0 gene) and to the control ChIP sample. Significant reduced (green) or gained (red) mobilization of Foxa2 in ERKO livers is indicated in the lower heatmap. Calculated P values from Mann-Whitney t tests are indicated as follows: *, P < .05; **, P < .01.
Figure 10.
Figure 10.. Chromatin status of Foxa2 BSs in ERWT and ERKO mouse livers.
A and B, Alignment of mean H3K4me2 (left side of the panel) or H3K27ac signals on categorized Foxa2 BSs. Insets represent magnified views of the center of the graphs and illustrate the observed shift from biphasic to monophasic curves of enrichment in H3K4me2. C, Heatmap representation of results obtained in independent anti-H3K4me1, H3K4me2, and H3K27ac ChIP-qPCR experiments. The presence of these marks was followed in livers from ERWT and ERKO animals (numbers on the right refer to individuals) at the indicated conserved or lost Foxa2 BSs. Experiments were done twice per individual. Mean fold enrichment values shown are expressed as relative to a control negative ChIP experiment using the same chromatin samples. D, Summary of MeDIP- and hMeDIP-qPCR assays, illustrated as in B. The values included within these graphs were obtained in 3 independent experiments performed on 2 different DNA samples originating from 2 different ERWT or ERKO animals. Significant reduced (green) or gained (red) enrichment in histone marks or DNA modifications in ERKO livers are indicated in the lower heatmaps. Calculated P values from Mann-Whitney t tests are indicated as follows: *, P < .05; **, P < .01.
Figure 11.
Figure 11.. Multiple TFs may protect Foxa2 BSs from loss of function in ERKO livers.
A, Wordle graphics (http://www.wordle.net/website) of enriched motifs for transcription factors binding within lost Foxa2 BSs; as determined by the SeqPos algorithm (http://cistrome.org/ap/). B, Overlap of categorized Foxa2 BSs with the cistromes of different transcription factors, all determined in mouse liver except Nkx3-1 BSs, which were identified in mouse prostate.

References

    1. Couse JF, Korach KS. Estrogen receptor null mice: what have we learned and where will they lead us? Endocr Rev. 1999;20:358–417. - PubMed
    1. McEwan IJ. Nuclear receptors: one big family. Methods Mol Biol. 2009;505:3–18. - PubMed
    1. Lenfant F, Trémollières F, Gourdy P, Arnal JF. Timing of the vascular actions of estrogens in experimental and human studies: why protective early, and not when delayed? Maturitas. 2011;68:165–173. - PubMed
    1. Carroll JS, Brown M. Estrogen receptor target gene: an evolving concept. Mol Endocrinol. 2006;20:1707–1714. - PubMed
    1. Eeckhoute J, Métivier R, Salbert G. Defining specificity of transcription factor regulatory activities. J Cell Sci. 2009;122:4027–4034. - PubMed

MeSH terms