

Digital elevation model and orthophotographs of Greenland based on aerial photographs from 1978-1987
- PMID: 27164457
- PMCID: PMC4862325
- DOI: 10.1038/sdata.2016.32
Digital elevation model and orthophotographs of Greenland based on aerial photographs from 1978-1987
Abstract
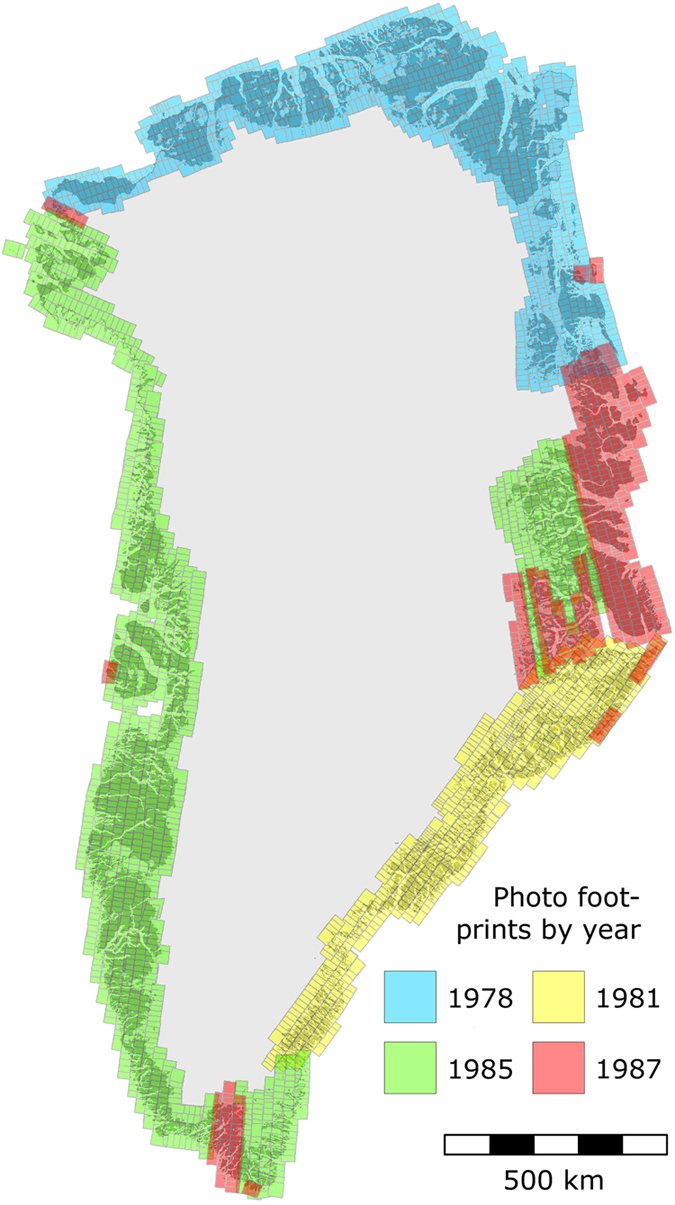
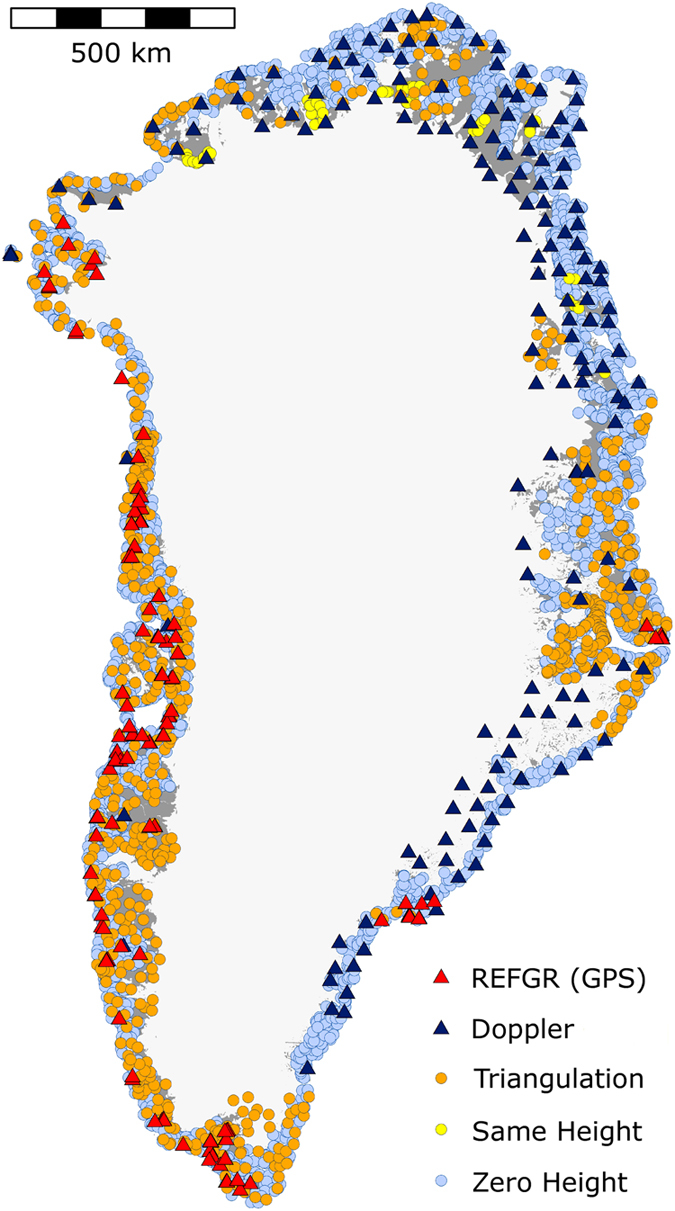
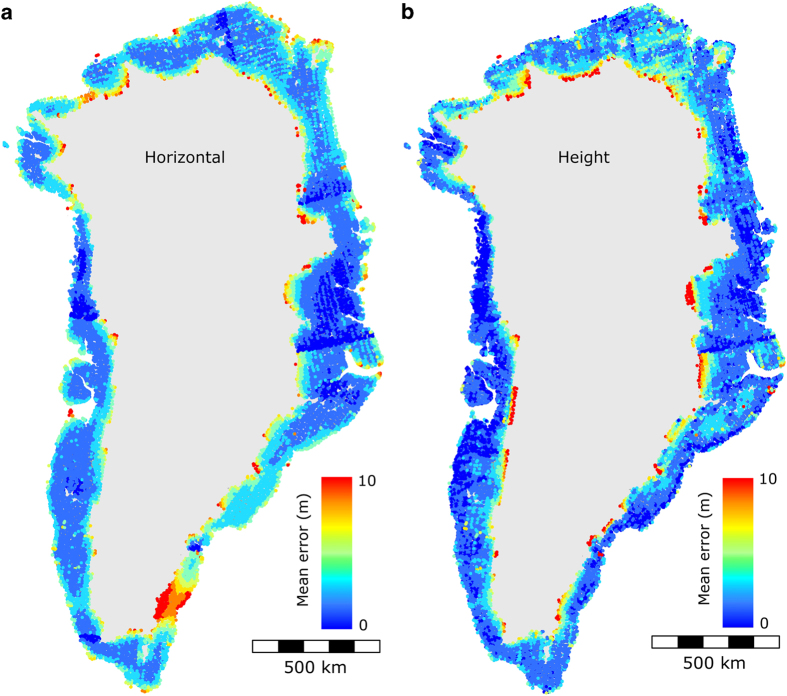
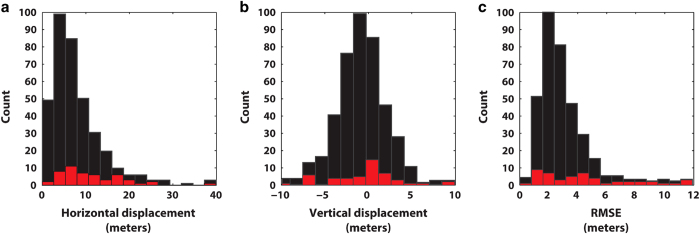
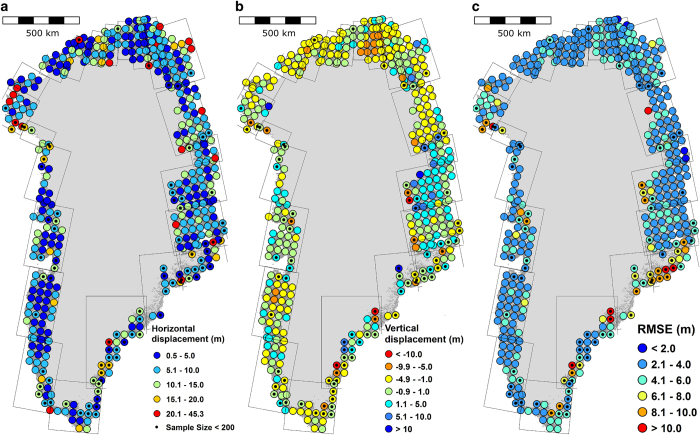
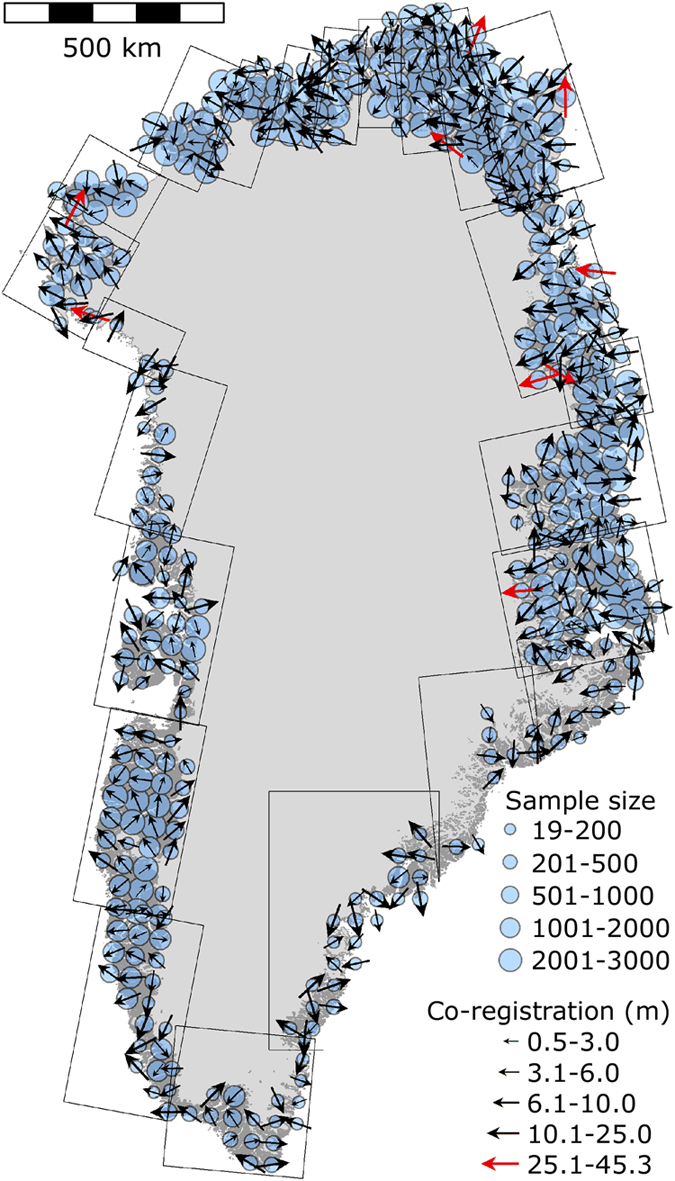
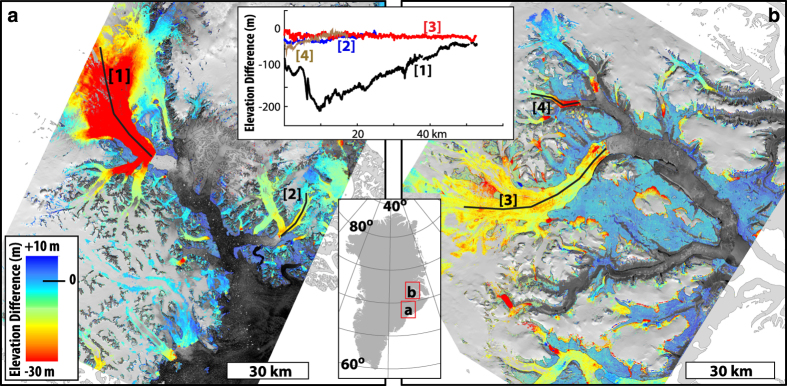
Digital Elevation Models (DEMs) play a prominent role in glaciological studies for the mass balance of glaciers and ice sheets. By providing a time snapshot of glacier geometry, DEMs are crucial for most glacier evolution modelling studies, but are also important for cryospheric modelling in general. We present a historical medium-resolution DEM and orthophotographs that consistently cover the entire surroundings and margins of the Greenland Ice Sheet 1978-1987. About 3,500 aerial photographs of Greenland are combined with field surveyed geodetic ground control to produce a 25 m gridded DEM and a 2 m black-and-white digital orthophotograph. Supporting data consist of a reliability mask and a photo footprint coverage with recording dates. Through one internal and two external validation tests, this DEM shows an accuracy better than 10 m horizontally and 6 m vertically while the precision is better than 4 m. This dataset proved successful for topographical mapping and geodetic mass balance. Other uses include control and calibration of remotely sensed data such as imagery or InSAR velocity maps.
Conflict of interest statement
The authors declare no competing financial interests.
Figures
Comment on
-
Aerial photographs reveal late-20th-century dynamic ice loss in northwestern Greenland.Science. 2012 Aug 3;337(6094):569-73. doi: 10.1126/science.1220614. Science. 2012. PMID: 22859486
-
Spatial and temporal distribution of mass loss from the Greenland Ice Sheet since AD 1900.Nature. 2015 Dec 17;528(7582):396-400. doi: 10.1038/nature16183. Nature. 2015. PMID: 26672555
References
Data Citations
-
- Korsgaard N. J. 2016. NOAA National Centers for Environmental Information. http://dx.doi.org/10.7289/V56Q1V72 - DOI
References
-
- Fastook J. L., Brecher H. H. & Hughes T. J. Derived bedrock elevations, strain rates and stresses from measured surface elevations and velocities-Jakobshavns-Isbrae, Greenland. J. Glaciol. 41, 161–173 (1995).
-
- Motyka R. J., Fahnestock M. & Truffer M. Volume change of Jakobshavn Isbrae, West Greenland: 1985-1997-2007. J. Glaciol. 56, 635–646 (2010).
-
- Korona J., Berthier E., Bernard M., Rémy F. & Thouvenot E. SPIRIT. SPOT 5 stereoscopic survey of Polar Ice: Reference images and topographies during the fourth International Polar Year (2007-2009). ISPRS J. Photogramm. Remote Sens 64, 204–212 (2009).
-
- Howat I. M., Smith B. E., Jougin I. & Scambos T. A. Rates of southeast Greenland ice volume loss from combined ICESat and ASTER observations. Geophys. Res. Lett. 35, 1–5 (2008).
-
- Willis M. J., Herried B. G., Bevis M. G. & Bell R. E. Recharge of a subglacial lake by surface meltwater in northeast Greenland. Nature 518, 223–227 (2015). - PubMed
Publication types
MeSH terms
Grants and funding
LinkOut - more resources
Full Text Sources
Other Literature Sources
