

Co-utilization of glucose and xylose by evolved Thermus thermophilus LC113 strain elucidated by (13)C metabolic flux analysis and whole genome sequencing
- PMID: 27164561
- PMCID: PMC5845448
- DOI: 10.1016/j.ymben.2016.05.001
Co-utilization of glucose and xylose by evolved Thermus thermophilus LC113 strain elucidated by (13)C metabolic flux analysis and whole genome sequencing
Abstract
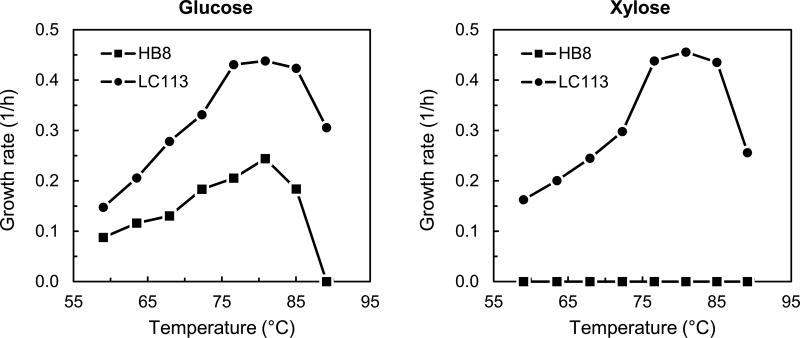
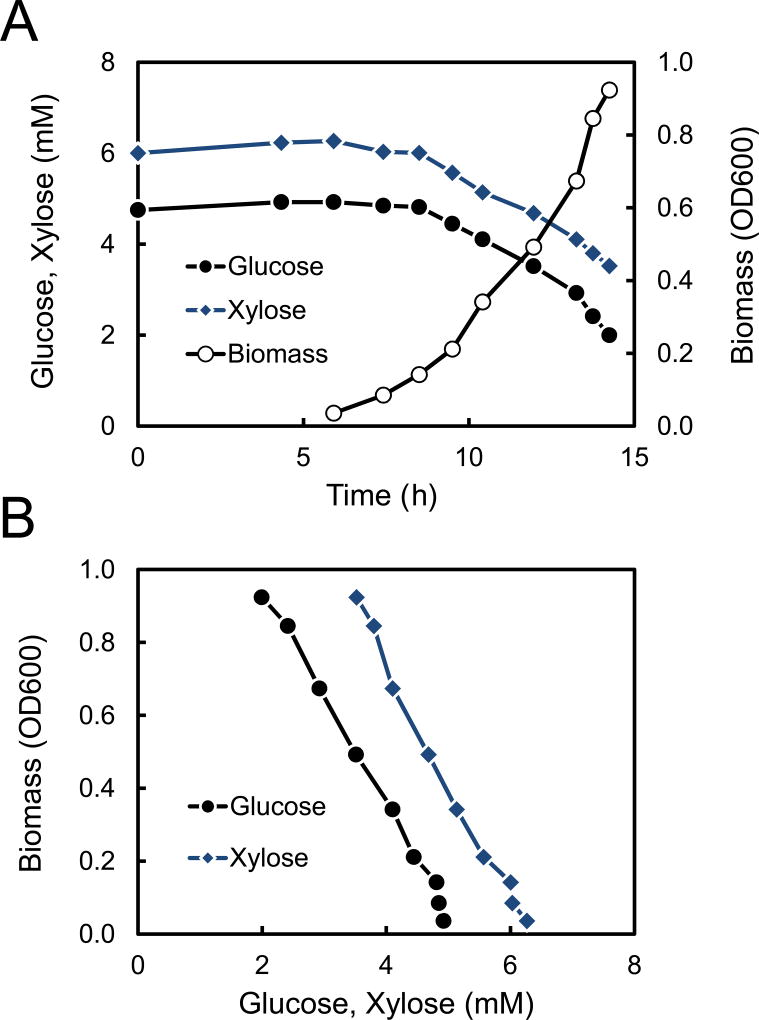
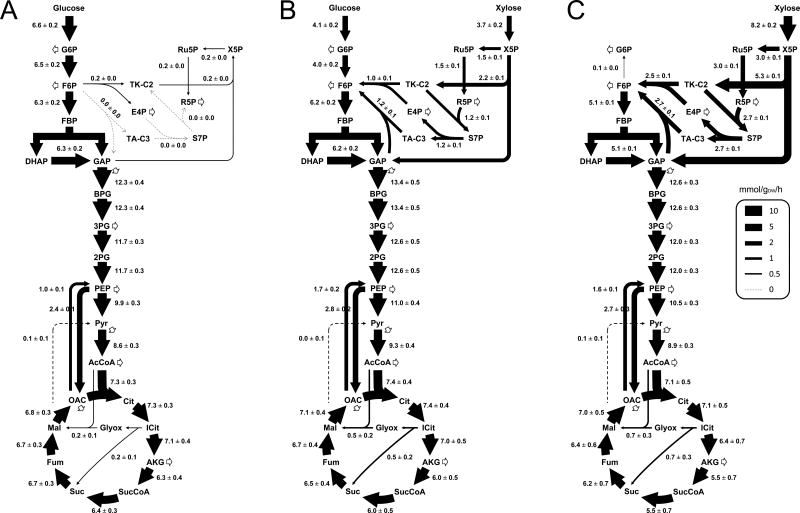
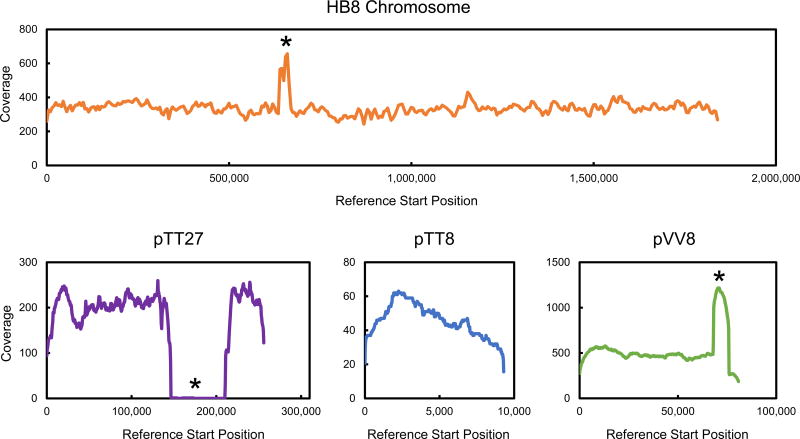
We evolved Thermus thermophilus to efficiently co-utilize glucose and xylose, the two most abundant sugars in lignocellulosic biomass, at high temperatures without carbon catabolite repression. To generate the strain, T. thermophilus HB8 was first evolved on glucose to improve its growth characteristics, followed by evolution on xylose. The resulting strain, T. thermophilus LC113, was characterized in growth studies, by whole genome sequencing, and (13)C-metabolic flux analysis ((13)C-MFA) with [1,6-(13)C]glucose, [5-(13)C]xylose, and [1,6-(13)C]glucose+[5-(13)C]xylose as isotopic tracers. Compared to the starting strain, the evolved strain had an increased growth rate (~2-fold), increased biomass yield, increased tolerance to high temperatures up to 90°C, and gained the ability to grow on xylose in minimal medium. At the optimal growth temperature of 81°C, the maximum growth rate on glucose and xylose was 0.44 and 0.46h(-1), respectively. In medium containing glucose and xylose the strain efficiently co-utilized the two sugars. (13)C-MFA results provided insights into the metabolism of T. thermophilus LC113 that allows efficient co-utilization of glucose and xylose. Specifically, (13)C-MFA revealed that metabolic fluxes in the upper part of metabolism adjust flexibly to sugar availability, while fluxes in the lower part of metabolism remain relatively constant. Whole genome sequence analysis revealed two large structural changes that can help explain the physiology of the evolved strain: a duplication of a chromosome region that contains many sugar transporters, and a 5x multiplication of a region on the pVV8 plasmid that contains xylose isomerase and xylulokinase genes, the first two enzymes of xylose catabolism. Taken together, (13)C-MFA and genome sequence analysis provided complementary insights into the physiology of the evolved strain.
Keywords: Co-utilization; Glucose and xylose metabolism; Isotopic labeling; Metabolic fluxes; Thermophile.
Copyright © 2016 International Metabolic Engineering Society. Published by Elsevier Inc. All rights reserved.
Figures
Similar articles
-
Comprehensive analysis of glucose and xylose metabolism in Escherichia coli under aerobic and anaerobic conditions by 13C metabolic flux analysis.Metab Eng. 2017 Jan;39:9-18. doi: 10.1016/j.ymben.2016.11.003. Epub 2016 Nov 11. Metab Eng. 2017. PMID: 27840237 Free PMC article.
-
(13)C metabolic flux analysis of the extremely thermophilic, fast growing, xylose-utilizing Geobacillus strain LC300.Metab Eng. 2016 Jan;33:148-157. doi: 10.1016/j.ymben.2015.06.004. Epub 2015 Jun 20. Metab Eng. 2016. PMID: 26100076
-
Optimal tracers for parallel labeling experiments and 13C metabolic flux analysis: A new precision and synergy scoring system.Metab Eng. 2016 Nov;38:10-18. doi: 10.1016/j.ymben.2016.06.001. Epub 2016 Jun 4. Metab Eng. 2016. PMID: 27267409 Free PMC article.
-
New insights into transport capability of sugars and its impact on growth from novel mutants of Escherichia coli.Appl Microbiol Biotechnol. 2020 Feb;104(4):1463-1479. doi: 10.1007/s00253-019-10335-x. Epub 2020 Jan 4. Appl Microbiol Biotechnol. 2020. PMID: 31900563 Review.
-
Bioenergetics at extreme temperature: Thermus thermophilus ba(3)- and caa(3)-type cytochrome c oxidases.Biochim Biophys Acta. 2012 Apr;1817(4):638-49. doi: 10.1016/j.bbabio.2011.08.004. Biochim Biophys Acta. 2012. PMID: 22385645 Review.
Cited by
-
The emergence of adaptive laboratory evolution as an efficient tool for biological discovery and industrial biotechnology.Metab Eng. 2019 Dec;56:1-16. doi: 10.1016/j.ymben.2019.08.004. Epub 2019 Aug 8. Metab Eng. 2019. PMID: 31401242 Free PMC article. Review.
-
13C metabolic flux analysis of three divergent extremely thermophilic bacteria: Geobacillus sp. LC300, Thermus thermophilus HB8, and Rhodothermus marinus DSM 4252.Metab Eng. 2017 Nov;44:182-190. doi: 10.1016/j.ymben.2017.10.007. Epub 2017 Oct 14. Metab Eng. 2017. PMID: 29037779 Free PMC article.
-
How adaptive evolution reshapes metabolism to improve fitness: recent advances and future outlook.Curr Opin Chem Eng. 2018 Dec;22:209-215. doi: 10.1016/j.coche.2018.11.001. Epub 2018 Nov 26. Curr Opin Chem Eng. 2018. PMID: 30613467 Free PMC article.
-
Comprehensive analysis of glucose and xylose metabolism in Escherichia coli under aerobic and anaerobic conditions by 13C metabolic flux analysis.Metab Eng. 2017 Jan;39:9-18. doi: 10.1016/j.ymben.2016.11.003. Epub 2016 Nov 11. Metab Eng. 2017. PMID: 27840237 Free PMC article.
-
Metabolism of the fast-growing bacterium Vibrio natriegens elucidated by 13C metabolic flux analysis.Metab Eng. 2017 Nov;44:191-197. doi: 10.1016/j.ymben.2017.10.008. Epub 2017 Oct 16. Metab Eng. 2017. PMID: 29042298 Free PMC article.
References
-
- Antoniewicz MR. 13C metabolic flux analysis: optimal design of isotopic labeling experiments. Curr Opin Biotechnol. 2013;24:1116–21. - PubMed
-
- Antoniewicz MR. Parallel labeling experiments for pathway elucidation and 13C metabolic flux analysis. Curr Opin Biotechnol. 2015;36:91–97. - PubMed
-
- Antoniewicz MR, Kelleher JK, Stephanopoulos G. Determination of confidence intervals of metabolic fluxes estimated from stable isotope measurements. Metab Eng. 2006;8:324–37. - PubMed
-
- Antoniewicz MR, Kelleher JK, Stephanopoulos G. Accurate assessment of amino acid mass isotopomer distributions for metabolic flux analysis. Anal Chem. 2007a;79:7554–9. - PubMed
Publication types
MeSH terms
Substances
Grants and funding
LinkOut - more resources
Full Text Sources
Other Literature Sources
Molecular Biology Databases
