

[(68)Ga]NODAGA-RGD - Metabolic stability, biodistribution, and dosimetry data from patients with hepatocellular carcinoma and liver cirrhosis
- PMID: 27164900
- PMCID: PMC5007270
- DOI: 10.1007/s00259-016-3396-3
[(68)Ga]NODAGA-RGD - Metabolic stability, biodistribution, and dosimetry data from patients with hepatocellular carcinoma and liver cirrhosis
Abstract
Purpose: This study was designed to determine safety, tolerability, and radiation burden of a [(68)Ga]NODAGA-RGD-PET for imaging integrin αvβ3 expression in patients with hepatocellular carcinoma (HCC) and liver cirrhosis. Moreover, metabolic stability and biokinetic data were compiled.
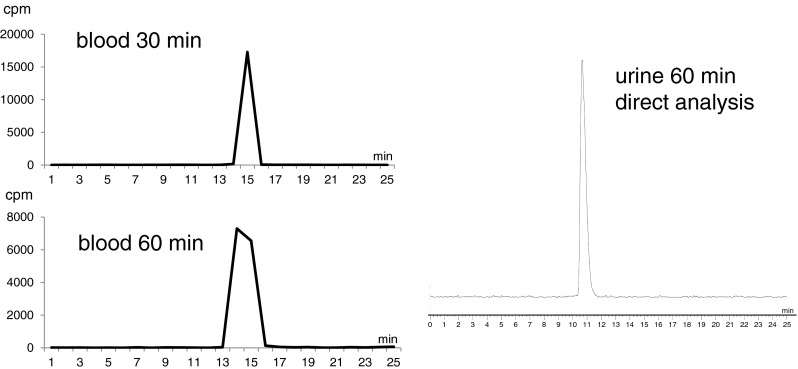
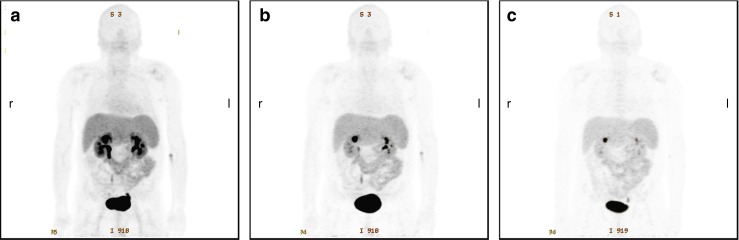
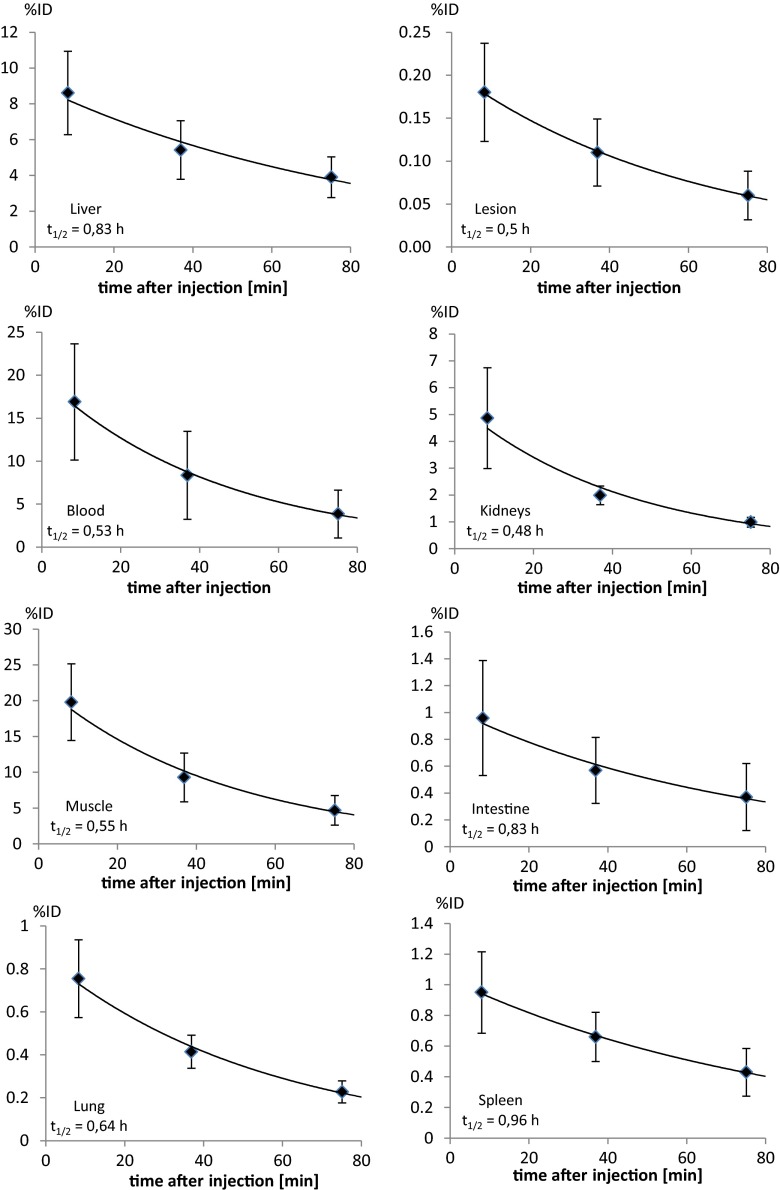
Methods: After injection of 154-184 MBq [(68)Ga]NODAGA-RGD three consecutive PET/CT scans were acquired starting 8.3 ± 2.1, 36.9 ± 2.8, and 75.1 ± 3.4 min after tracer injection. For metabolite analysis, blood and urine samples were analyzed by HPLC. For dosimetry studies, residence time VOIs were placed in the corresponding organs. The OLINDA/EXM program was used to estimate the absorbed radiation dose.
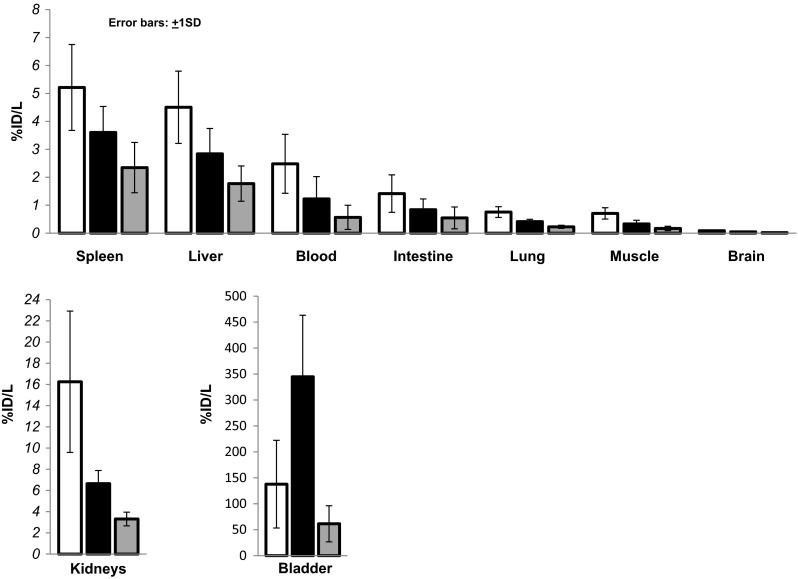
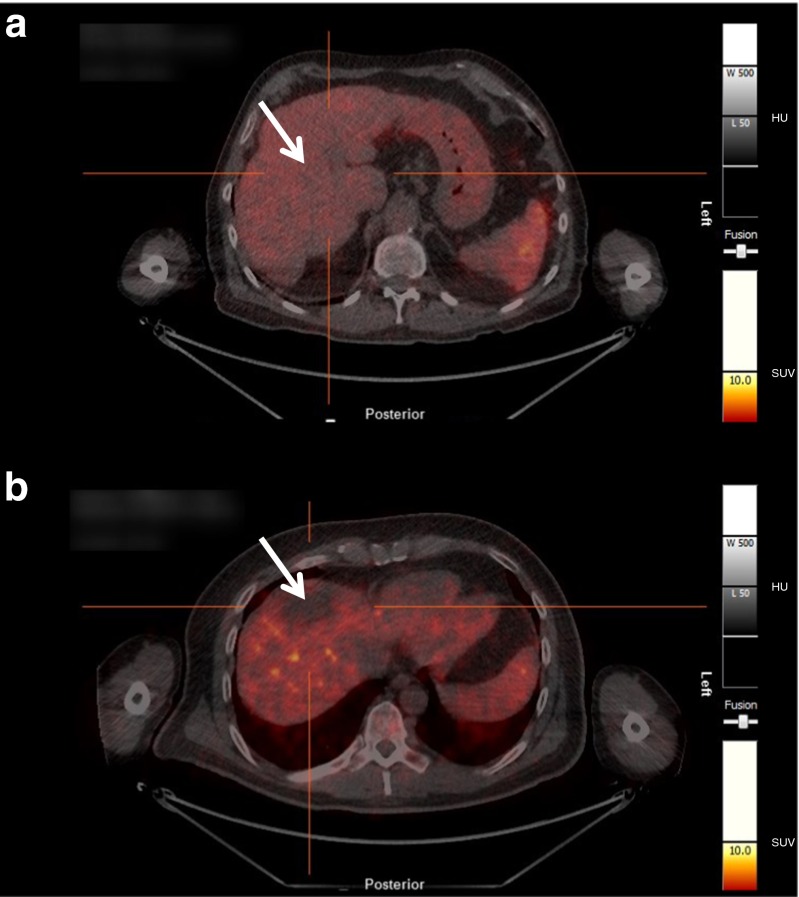
Results: The radiopharmaceutical was well tolerated and no drug-related adverse effects were observed. No metabolites could be detected in blood (30 and 60 min p.i.) and urine (60 min p.i.). [(68)Ga]NODAGA-RGD showed rapid and predominantly renal elimination. Background radioactivity in blood, intestine, lung, and muscle tissue was low (%ID/l 60 min p.i. was 0.56 ± 0.43, 0.54 ± 0.39, 0.22 ± 0.05, and 0.16 ± 0.8, respectively). The calculated effective dose was 21.5 ± 5.4 μSv/MBq, and the highest absorbed radiation dose was found for the urinary bladder wall (0.26 ± 0.09 mSv/MBq). No increased uptake of the tracer was found in HCC compared with the background liver tissue.
Conclusions: [(68)Ga]NODAGA-RGD uptake in the HCCs lesions was not sufficient to use this tracer for imaging these tumors. [(68)Ga]NODAGA-RGD was well tolerated and metabolically stable. Due to rapid renal excretion, background radioactivity was low in most of the body, resulting in low radiation burden and indicating the potential of [(68)Ga]NODAGA-RGD PET for non-invasive determination of integrin αvβ3 expression.
Keywords: Dosimetry; Hepatocellular carcinoma; Metabolic stability; PET; Whole-body distribution; [68Ga]NODAGA-RGD.
Conflict of interest statement
Compliance with ethical standards Funding This study was not funded by any organization. Conflict of interest The author(s) declare that they have no competing interests. Ethical approval This article does not contain any studies with animals performed by any of the authors. All procedures performed in this study involving human participants were approved by the ethics committee of the Medical University of Innsbruck and the Austrian Competent Authority (BASG, EudraCT No. 2013-003741-42) and were in accordance with the 1964 Helsinki Declaration and its later amendments or comparable ethical standards. Informed consent Informed written consent was obtained from all individual participants included in the study.
Figures
Similar articles
-
PET-Based Human Dosimetry of the Dimeric αvβ3 Integrin Ligand 68Ga-DOTA-E-[c(RGDfK)]2, a Potential Tracer for Imaging Tumor Angiogenesis.J Nucl Med. 2016 Mar;57(3):404-9. doi: 10.2967/jnumed.115.161653. Epub 2015 Nov 19. J Nucl Med. 2016. PMID: 26585063
-
Biodistribution and radiation dosimetry of the integrin marker 18F-RGD-K5 determined from whole-body PET/CT in monkeys and humans.J Nucl Med. 2012 May;53(5):787-95. doi: 10.2967/jnumed.111.088955. Epub 2012 Apr 12. J Nucl Med. 2012. PMID: 22499613 Free PMC article. Clinical Trial.
-
Clinical Translation of a Dual Integrin αvβ3- and Gastrin-Releasing Peptide Receptor-Targeting PET Radiotracer, 68Ga-BBN-RGD.J Nucl Med. 2017 Feb;58(2):228-234. doi: 10.2967/jnumed.116.177048. Epub 2016 Aug 4. J Nucl Med. 2017. PMID: 27493267 Free PMC article.
-
What about αvβ3 integrins in molecular imaging in oncology?Nucl Med Biol. 2018 Jul-Aug;62-63:31-46. doi: 10.1016/j.nucmedbio.2018.04.006. Epub 2018 May 4. Nucl Med Biol. 2018. PMID: 29807242 Review.
-
Molecular imaging and therapy targeting copper metabolism in hepatocellular carcinoma.World J Gastroenterol. 2016 Jan 7;22(1):221-31. doi: 10.3748/wjg.v22.i1.221. World J Gastroenterol. 2016. PMID: 26755872 Free PMC article. Review.
Cited by
-
Drug delivery strategy in hepatocellular carcinoma therapy.Cell Commun Signal. 2022 Mar 5;20(1):26. doi: 10.1186/s12964-021-00796-x. Cell Commun Signal. 2022. PMID: 35248060 Free PMC article. Review.
-
[68Ga]Ga-NODAGA-E[(cRGDyK)]2 PET and hyperpolarized [1-13C] pyruvate MRSI (hyperPET) in canine cancer patients: simultaneous imaging of angiogenesis and the Warburg effect.Eur J Nucl Med Mol Imaging. 2021 Feb;48(2):395-405. doi: 10.1007/s00259-020-04881-0. Epub 2020 Jul 3. Eur J Nucl Med Mol Imaging. 2021. PMID: 32621132 Free PMC article.
-
EGFR- and Integrin αVβ3-Targeting Peptides as Potential Radiometal-Labeled Radiopharmaceuticals for Cancer Theranostics.Int J Mol Sci. 2024 Aug 5;25(15):8553. doi: 10.3390/ijms25158553. Int J Mol Sci. 2024. PMID: 39126121 Free PMC article. Review.
-
Preliminary Clinical Application of RGD-Containing Peptides as PET Radiotracers for Imaging Tumors.Front Oncol. 2022 Mar 2;12:837952. doi: 10.3389/fonc.2022.837952. eCollection 2022. Front Oncol. 2022. PMID: 35311120 Free PMC article. Review.
-
Berberine Facilitates Angiogenesis Against Ischemic Stroke Through Modulating Microglial Polarization via AMPK Signaling.Cell Mol Neurobiol. 2019 Aug;39(6):751-768. doi: 10.1007/s10571-019-00675-7. Epub 2019 Apr 24. Cell Mol Neurobiol. 2019. PMID: 31020571 Free PMC article.
References
-
- EASL-EORTC clinical practice guidelines: management of hepatocellular carcinoma. J Hepatology 2012;56:908-43. - PubMed
Publication types
MeSH terms
Substances
LinkOut - more resources
Full Text Sources
Other Literature Sources
Medical
