Review
. 2016 Aug;7(4):553-69.
doi: 10.1007/s13244-016-0492-7. Epub 2016 May 10.

MRI in multiple myeloma: a pictorial review of diagnostic and post-treatment findings

Affiliations
Review

MRI in multiple myeloma: a pictorial review of diagnostic and post-treatment findings

Julie C Dutoit et al. Insights Imaging. 2016 Aug.

Abstract

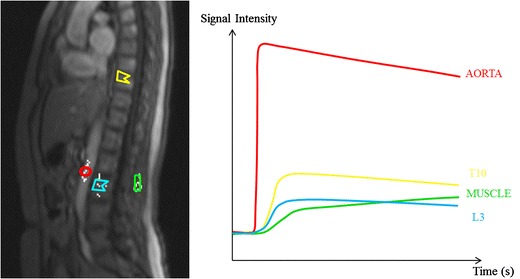
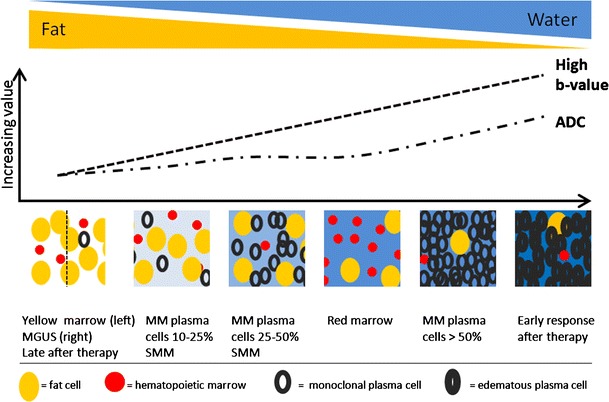
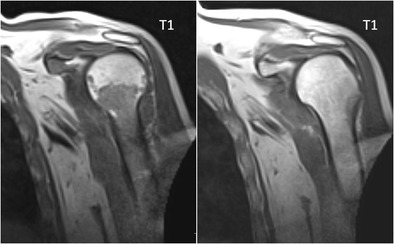
Magnetic resonance imaging (MRI) is increasingly being used in the diagnostic work-up of patients with multiple myeloma. Since 2014, MRI findings are included in the new diagnostic criteria proposed by the International Myeloma Working Group. Patients with smouldering myeloma presenting with more than one unequivocal focal lesion in the bone marrow on MRI are considered having symptomatic myeloma requiring treatment, regardless of the presence of lytic bone lesions. However, bone marrow evaluation with MRI offers more than only morphological information regarding the detection of focal lesions in patients with MM. The overall performance of MRI is enhanced by applying dynamic contrast-enhanced MRI and diffusion weighted imaging sequences, providing additional functional information on bone marrow vascularization and cellularity.This pictorial review provides an overview of the most important imaging findings in patients with monoclonal gammopathy of undetermined significance, smouldering myeloma and multiple myeloma, by performing a 'total' MRI investigation with implications for the diagnosis, staging and response assessment. Main message • Conventional MRI diagnoses multiple myeloma by assessing the infiltration pattern. • Dynamic contrast-enhanced MRI diagnoses multiple myeloma by assessing vascularization and perfusion. • Diffusion weighted imaging evaluates bone marrow composition and cellularity in multiple myeloma. • Combined morphological and functional MRI provides optimal bone marrow assessment for staging. • Combined morphological and functional MRI is of considerable value in treatment follow-up.

Keywords: Diffusion weighted imaging; Dynamic contrast-enhanced MRI; Magnetic resonance imaging; Multiple myeloma; Response assessment.


Figures

Fig. 1
Fig. 1
Coronal T1-weighted (left) and T2-weighted STIR (right) coronal whole body MR images displaying a diffuse marrow infiltration in the spine, pelvis, femora, humeri, ribs and scapulae. Lesions appear hypointense on T1-weighted images and hyperintense on the STIR images. Remark the good contrast resolution of STIR images in revealing infiltration of the ribs: ‘white ribs sign’
Fig. 2
Fig. 2
Sagittal T1-weighted (left) and fat-suppressed T2-weighted (right) images of the spine displaying a diffuse bone marrow infiltration of the cervical, thoracic, lumbar and sacral spine with low signal intensity on T1- and intermediate to high signal intensity on fat-suppressed T2-weighted images
Fig. 3
Fig. 3
A parasagittal dynamic contrast-enhanced MR image is displayed with regions of interest (ROI) drawn in the aorta (red circle), paraspinal muscle (green rectangle), vertebra T10 (yellow polygon) and L3 (blue polygon). ROI-selection in the vertebrae should exclude the entrance of the vertebral vessels and the endplates. This method provides a corresponding time-intensity curve displayed on the right, providing information on tissue vascularization, perfusion, vessel permeability and volume of the interstitial space
Fig. 4
Fig. 4
Five types of time-intensity curves (TICs) have been described. Type 1 (blue) demonstrates no enhancement, whereas type 2 (green) illustrates a slow sustained enhancement. Type 3 (purple), 4 (orange) and 5 (red) are characterized by a steep and fast first pass enhancement; in type 3 this is followed by a sustained late enhancement; in type 4 this is followed by a wash-out of contrast medium caused by a small interstitial space. The steep wash-in of type 5 is followed by a stable late enhancement
Fig. 5
Fig. 5
Example of diffusion weighted b-value images b0-b200-b600-b1000. The upper sequence demonstrates the b-value images of a patient with monoclonal gammopathy of undetermined significance, the lower sequence images belong to a patients with multiple myeloma. The signal intensity of myeloma lesions are typically high on b-value images, due to the low amount of fat cells, increased cellularity and water amount. Remark the good visibility of the vertebral bodies and spinous processes in this patient with multiple myeloma
Fig. 6
Fig. 6
MR images of a patient with monoclonal gammopathy of undetermined significance, with 5 % plasma cells on bone marrow biopsy. a T1-weighted and fat-suppressed T2-weighted images of the thoracolumbar spine displaying normal bone marrow signal intensities, hyperintense on T1 and hypointense on fat-suppressed T2-weighted images. b DWI b1000 images with normal appearing bone marrow, low signal intensity due to the high amount of fat and low cellularity with low water diffusivity. c Time-intensity curve derived from DCE-MR imaging with a TIC type 1 (L3 - blue) and type 2 (T10 - yellow) curve, corresponding to a normal vascularization of the bone marrow, no signs of neoangiogenesis
Fig. 7
Fig. 7
MR images of a patient with smouldering multiple myeloma, 15 % plasma cells on bone marrow biopsy. a T1-weighted and fat-suppressed T2-weighted images of the thoracolumbar spine displaying altered bone marrow signal intensities, with slight diffuse signal decrease on T1 images without significant changes on T2-weighted images. b Normal signal intensity on b1000 images, due to the residual high amount of fat cells in the bone marrow. c Time-intensity curve derived from DCE-MR imaging with TIC type 1, corresponding to a normal vascularization of the bone marrow without signs of neoangiogenesis
Fig. 8
Fig. 8
MR images of a patient with symptomatic multiple myeloma, 30 % plasma cells on bone marrow biopsy. a T1-weighted and T2-weighted STIR coronal images of the body and b T1-weighted and fat-suppressed T2-weighted images of the thoracolumbar spine displaying a significant decrease of signal intensity on T1-weighted images with a corresponding increased signal intensity on T2-weighted images, diffuse infiltration pattern, and also remark the additional focal lesions in the vertebral bodies of T2 and T9 (arrows). c Increased signal intensity on DWI b1000 images, due to a decrease in bone marrow fat cells, increased cellularity, and water amount with corresponding increase in water diffusivity. d Increased angiogenesis, perfusion and vascular permeability displayed in a time-intensity curve type 4, with early wash-out of the contrast medium
Fig. 9
Fig. 9
Bone marrow infiltration patterns. a Normal appearing bone marrow, b focal (arrow) and c diffuse myeloma infiltration pattern, d combination of focal and diffuse infiltration and finally e salt-and-pepper infiltration pattern
Fig. 10
Fig. 10
This figure displays the change in signal intensity on b images and ADC value during the disease course from monoclonal gammopathy of undetermined significance, over smouldering to myeloma-infiltrated bone marrow with plasma cell percentages of 10-25 %, 25-50 % and >50 %, followed by the changes early and late after therapy, and compared to normal red and yellow marrow. The different diffusion characteristics are explained by changes in the amount of fat and interstitial water, with an increasing water proton diffusivity as fat decreases and interstitial water increases
Fig. 11
Fig. 11
These images present the same patient as in Fig. 8, with response to therapy, 100 days after autologous stem cell transplantation, with 5 % plasma cells on bone marrow on biopsy. a T1-weighted and T2-weighted STIR coronal images of the body and b T1-weighted and fat-suppressed T2-weighted images of the thoracolumbar spine, demonstrating a clear increase in signal intensity on T1-weighted and decrease on T2-weighted images, due to reappearance of normal bone marrow. c There is a residual high signal intensity on the b1000 images, due to residual oedema and necrosis after therapy despite the return of fat cells, accompanied by d a decrease in perfusion due to destruction of the neovasculature with the reappearance of a type 1 (L3 - blue) and type 2 (T10 - yellow) curve
Fig. 12
Fig. 12
These images illustrate the same patient as in Figs. 8 and 10, with a relapse 1 year after autologous stem cell transplantation with 30 % plasma cells in the bone marrow on biopsy. a T1-weighted and fat-suppressed T2-weighted images of the thoracolumbar spine, with a subtle decrease in signal intensity on T1-weighted and increase on T2-weighted images, reappearance of normal bone marrow. b The changes are more clearly illustrated on the b1000 images with apparent increase in signal intensity, reflecting the increased cellularity and water amount compared to the previous images. c The changes in bone marrow composition are accompanied by the return of an active TIC type 4, due to neoangiogenesis
Fig. 13
Fig. 13
T1-weighted image of the sacrum before (top) and after (bottom) radiation therapy, presenting the appearance of a peripheral halo of fatty marrow with a characteristic high signal intensity on T1-weighted images (arrows), indicating response to therapy
Fig. 14
Fig. 14
T1-weighted image of the humerus before (left) and after (right) systemic therapy. Remark the progressive fading of the bone marrow signal intensity, from hypo-intense to hyperintense signal intensity on T1-weighted imaging, indicating response to therapy
Fig. 15
Fig. 15
T1-weighted (top) and T2-weighted STIR (bottom) images of newly diagnosed myeloma patient a with diffuse infiltration of the bone marrow and a large focal lesion in the right intertrochanteric region (arrows). Five years after receiving systemic therapy and local irradiation on the right intertrochanteric region b there is an increase in signal intensity in the centre of the focal lesion on STIR images compatible with necrosis. Also remark the broad fatty halo surrounding the lesion. Both of these imaging findings indicate good response to therapy
Fig. 16
Fig. 16
T2-weighted (left) images of a hyperintense focal lesion (white arrow) a in a thoracic vertebra of a newly diagnosed myeloma patient with the corresponding b1000 image (right), showing the focal lesion together with a slightly diffusely increased signal intensity in the all vertebral bodies. b After systemic treatment and local irradiation on the focal lesion the signal intensity of the focal lesion increases on the T2-weighted image, indicating response and tumour necrosis, with residual hyperintensity on the b1000 image (right), due to the large water amount after necrosis: T2-shine-through effect
Fig. 17
Fig. 17
MR images of healthy young subject with normal red bone marrow. a The bone marrow appears hypointense on T1-weighted images (left), without focal lesions and with a corresponding high signal intensity on fat-suppressed T2-weighted images (right). b There is a high signal intensity on b1000 images due to the low amount of fat cells, high cellularity (hematopoietic cells) and high amount of water. c The vascularization and perfusion are also high (TIC type 4), with an early wash-out of contrast medium

References

    1. Nanni C, Rubello D, Fanti S, et al. Role of 18F-FDG-PET and PET/CT imaging in thyroid cancer. Biomed Pharmacother. 2006;60:409–413. doi: 10.1016/j.biopha.2006.07.008. - DOI - PubMed
    1. Kyle RA, Durie BG, Rajkumar SV, et al. Monoclonal gammopathy of undetermined significance (MGUS) and smoldering (asymptomatic) multiple myeloma: IMWG consensus perspectives risk factors for progression and guidelines for monitoring and management. Leukemia. 2010;24:1121–1127. doi: 10.1038/leu.2010.60. - DOI - PMC - PubMed
    1. Smith D, Yong K. Multiple myeloma. BMJ. 2013;346:f3863. doi: 10.1136/bmj.f3863. - DOI - PubMed
    1. Rajkumar SV, Dimopoulos MA, Palumbo A, et al. International myeloma working group updated criteria for the diagnosis of multiple myeloma. Lancet Oncol. 2014;15:e538–548. doi: 10.1016/S1470-2045(14)70442-5. - DOI - PubMed
    1. Rajkumar SV. Myeloma today: disease definitions and treatment advances. Am J Hematol. 2016;91:90–100. doi: 10.1002/ajh.24236. - DOI - PMC - PubMed

LinkOut - more resources