. 2016 May 10:17:345.
doi: 10.1186/s12864-016-2657-7.

Time-resolved pathogenic gene expression analysis of the plant pathogen Xanthomonas oryzae pv. oryzae

Affiliations

Time-resolved pathogenic gene expression analysis of the plant pathogen Xanthomonas oryzae pv. oryzae

Seunghwan Kim et al. BMC Genomics. .

Abstract

Background: Plant-pathogen interactions at early stages of infection are important to the fate of interaction. Xanthomonas oryzae pv. oryzae (Xoo) causes bacterial blight, which is a devastating disease in rice. Although in vivo and in vitro systems have been developed to study rice-Xoo interactions, both systems have limitations. The resistance mechanisms in rice can be better studied by the in vivo approach, whereas the in vitro systems are suitable for pathogenicity studies on Xoo. The current in vitro system uses minimal medium to activate the pathogenic signal (expression of pathogenicity-related genes) of Xoo, but lacks rice-derived factors needed for Xoo activation. This fact emphasizes the need of developing a new in vitro system that allow for an easy control of both pathogenic activation and for the experiment itself.

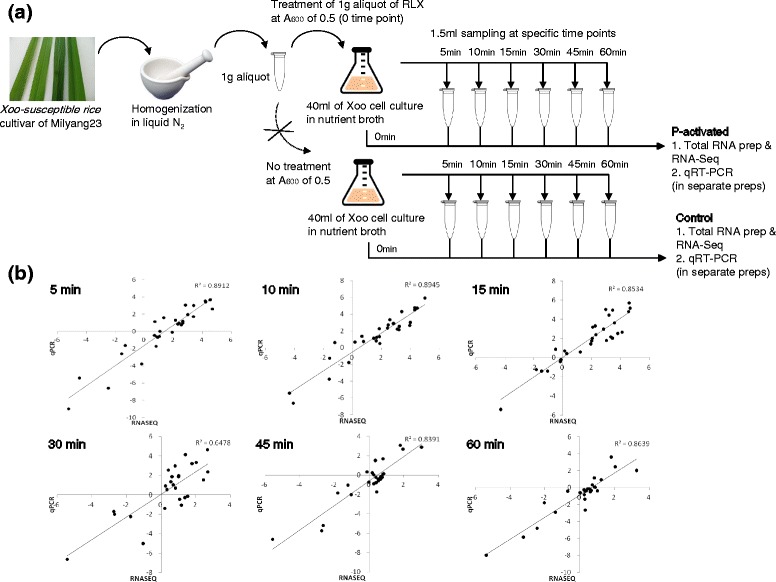
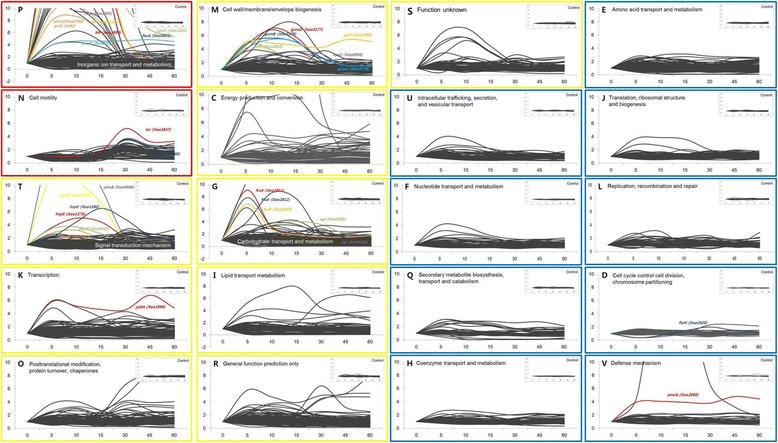
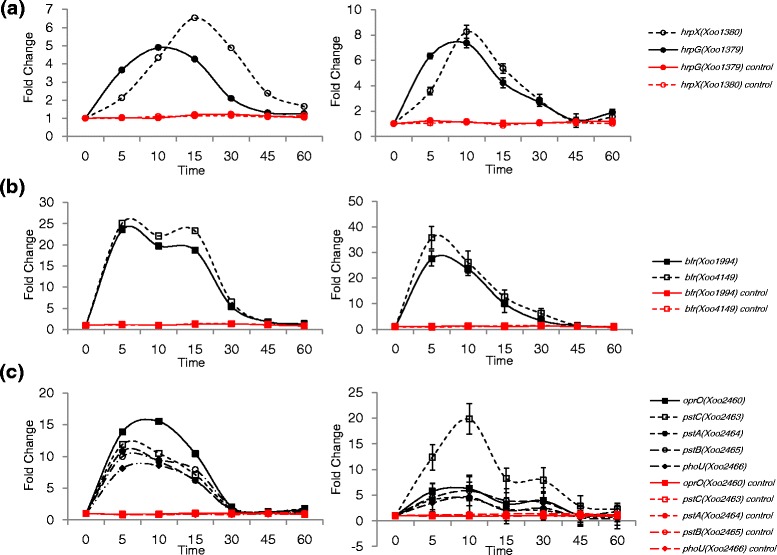
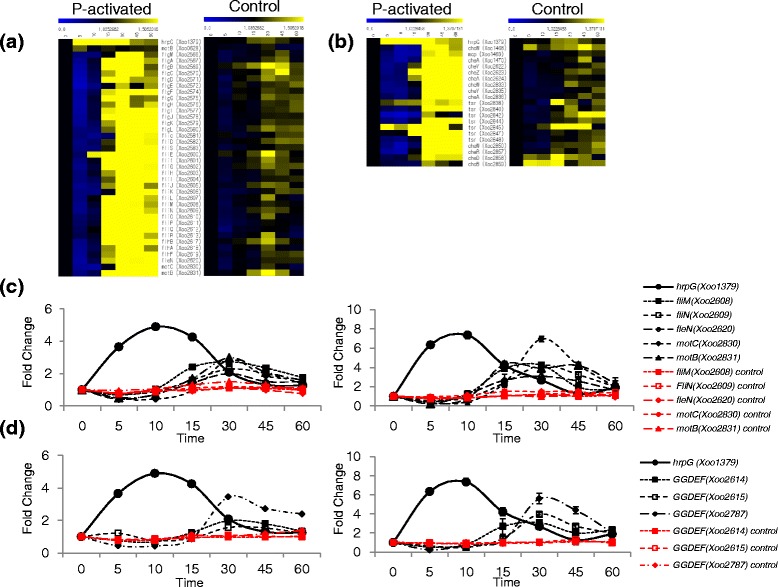
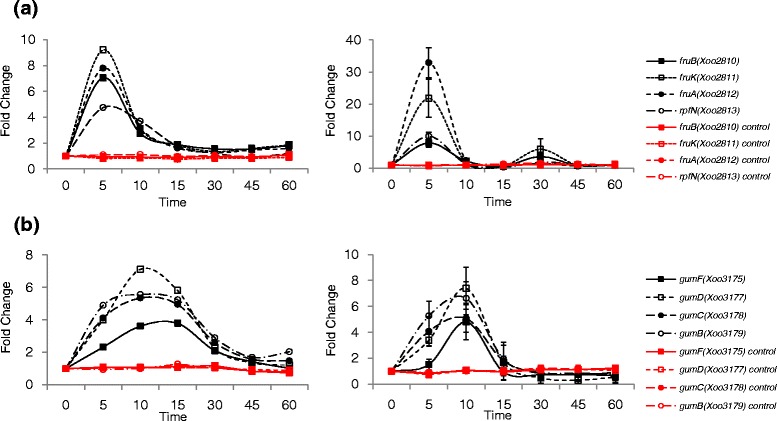
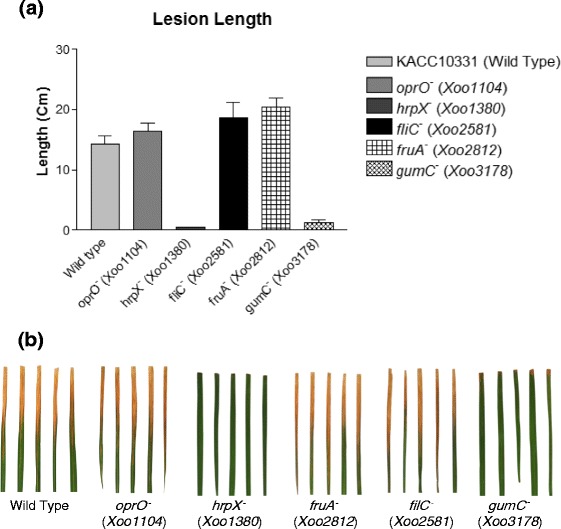
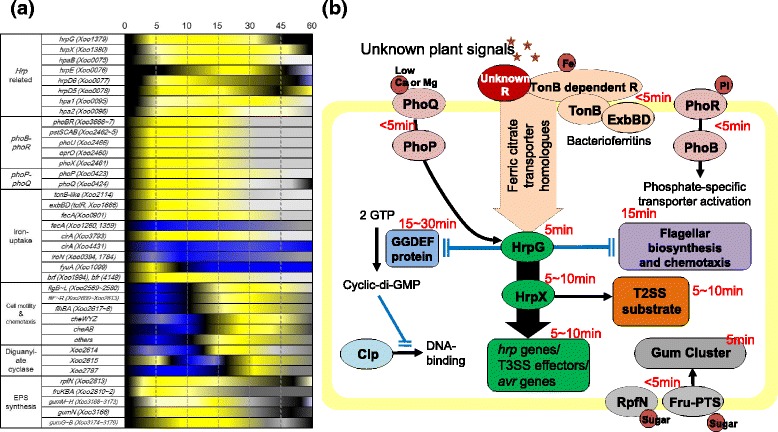
Results: We employed an in vitro system that can activate pathogenicity-related genes in Xoo using rice leaf extract (RLX) and combined the in vitro assay with RNA-Seq to analyze the time-resolved genome-wide gene expression of Xoo. RNA-Seq was performed with samples from seven different time points within 1 h post-RLX treatment and the expression of up- or downregulated genes in RNA-Seq was validated by qRT-PCR. Global analysis of gene expression and regulation revealed the most dramatic changes in functional categories of genes related to inorganic ion transport and metabolism, and cell motility. Expression of many pathogenicity-related genes was induced within 15 min upon contact with RLX. hrpG and hrpX expression reached the maximum level within 10 and 15 min, respectively. Chemotaxis and flagella biosynthesis-related genes and cyclic-di-GMP controlling genes were downregulated for 10 min and were then upregulated. Genes related to inorganic ion uptake were upregulated within 5 min. We introduced a non-linear regression fit to generate continuous time-resolved gene expression levels and tested the essentiality of the transcriptionally upregulated genes by a pathogenicity assay of lesion length using single-gene knock-out Xoo strains.

Conclusions: The in vitro system combined with RNA-Seq generated a genome-wide time-resolved pathogenic gene expression profile within 1 h of initial rice-Xoo interactions, demonstrating the expression order and interaction dependency of pathogenic genes. This combined system can be used as a novel tool to study the initial interactions between rice and Xoo during bacterial blight progression.

Keywords: Pathogenicity; Plant–pathogen interactions; RNA-Seq; Time-resolved genome-wide gene expression; Xanthomonas oryzae pv. oryzae.


Figures

Fig. 1
Fig. 1
a Schematic representation of the in vitro assay system and sampling for RNA-Seq and qRT-PCR. b Comparison of transcription levels by RNA-Seq and qRT-PCR. The relative transcription levels for 28 randomly selected genes from RNA-Seq data were verified by qRT-PCR. The log2-scaled values from qRT-PCR were plotted against the log2-scaled values from RNA-Seq data. The correlation coefficient (R2) of the datasets was between 0.65 and 0.89
Fig. 2
Fig. 2
Gene expression patterns of COG categories. Two functional categories of genes showing the most changes in gene expression are represented as red boxes. Nine functional categories of genes that showed moderate changes in gene expression are represented as yellow boxes. The other nine functional categories of genes that showed little changes in gene expression are represented as blue boxes. Inset figure at the upper right of each functional category of genes indicates the control (untreated). Colored lines and text indicate the representative genes of each COG category. Y-axis represents fold-change and is fixed at the value of 10
Fig. 3
Fig. 3
Time-resolved expression patterns of hrpG and hrpX genes, iron-uptake bacterioferritin genes and Pi-uptake genes. a RNA-Seq expression data of hrpG and hrpX (left) and qRT-PCR expression data of hrpG and hrpX (right). b RNA-Seq expression data of two bacterioferritin genes, Xoo1994 and Xoo4149 (left) and qRT-PCR expression data of Xoo1994 and Xoo4149 (right). c RNA-Seq expression data of oprO, pstC, pstA, pstB and phoU (left) and qRT-PCR expression data of oprO, pstC, pstA, pstB and phoU (right). The unit of time is min. Red lines indicate the expression levels of genes in the control (untreated) Xoo cells. Y-axis represents fold-change
Fig. 4
Fig. 4
Time-resolved expression of chemotaxis and motility-related genes and the second messenger of cyclic-di-GMP related genes. a Time-resolved heat map of the flagella biosynthesis-related genes in the pathogenicity-activated (P-activated) Xoo and the control Xoo. The expression level of each gene is shown as color change according to the fold change. The separate upper bar indicates the relation between color and the fold change value of gene expression; blue color represents most downregulated genes and yellow color represents the most upregulated genes in the column of comparison. b Time-resolved heat map of chemotaxis-related genes. Representation is the same as that of (a). c Time-resolved expression of hrpG and flagella biosynthesis-related genes from RNA-Seq (left) and qRT-PCR (right). d Time-resolved expression of hrpG and genes of the GGDEF domain-containing proteins from RNA-Seq (left) and qRT-PCR (right). The unit of time is min. Red lines represent the expression levels of genes in the control (untreated) Xoo cells. Y-axis represents fold-change
Fig. 5
Fig. 5
Time-resolved expression of sugar transport-related genes. a Time-resolved expression of fructose-specific phosphotransferase system genes and the carbohydrate selective porin gene, rpfN, from RNA-Seq (left) and qRT-PCR (right). b Time-resolved expression of gum operon genes from RNA-Seq (left) and qRT-PCR (right). The unit of time is min. Red lines indicate the expression levels of genes in the control (untreated) Xoo cells. Y-axis represents fold-change
Fig. 6
Fig. 6
Pathogenicity test of transcriptionally upregulated genes using the lesion length test. a Lesion length in Xoo-susceptible rice leaves infected by single-gene knockout Xoo mutants. b Infected rice leaves in multiple experiments
Fig. 7
Fig. 7
a Continuous time-resolved heat map of representative putative pathogenicity-related genes. Upregulated genes are shown in yellow and downregulated genes are shown in blue. Continuous gene expression levels are proposed by non-linear regression data fitting using RNA-Seq data from seven different time points. Details are shown in Additional file 16: Figure S8. b Schematic model of the pathogenicity signaling pathways in Xoo. Plant pathogenic signals activate unknown receptor proteins, which relay the pathogenic signal to the global regulators such as HrpG. Activated HrpG delivers the signal to HrpX, which activates a large set of virulence genes such as T3SS and T3SS effectors (green). HrpX activates T2SS substrate gene expression (orange). Activated HrpG suppresses flagella biosynthesis- and chemotaxis-related genes (purple) and GGDEF domain-containing proteins (light blue) by which the synthesized cyclic-di-GMP binds to Clp (cyan) and abolishes the DNA binding of Clp. Two-component systems (salmon) are upregulated by the pathogenicity signal. Sugar-uptake genes (grey) such as rpfN and fructose-specific phosphotransferase system genes are also upregulated. In the early pathogenicity signal, iron-uptake genes (light orange) such as the TonB-dependent receptor, TonB, ExbB, ExbD and ferric citrate transporter genes are upregulated. Black arrows indicate activation signals and blocked blue lines indicate repression signals. The time of gene expression at transcription level is labeled for each pathway in red letters

Similar articles

Cited by

References

    1. Jones JD, Dangl JL. The plant immune system. Nature. 2006;444(7117):323–9. doi: 10.1038/nature05286. - DOI - PubMed
    1. Li JY, Wang J, Zeigler RS. The 3,000 rice genomes project: new opportunities and challenges for future rice research. GigaScience. 2014;3:8. doi: 10.1186/2047-217X-3-8. - DOI - PMC - PubMed
    1. Mew TW, Alvarez AM, Leach JE, Swings J. Focus on bacterial-blight of rice. Plant Dis. 1993;77(1):5–12. doi: 10.1094/PD-77-0005. - DOI
    1. Suh JP, Jeung JU, Noh TH, Cho YC, Park SH, Park HS, Shin MS, Kim CK, Jena KK. Development of breeding lines with three pyramided resistance genes that confer broad-spectrum bacterial blight resistance and their molecular analysis in rice. Rice. 2013;6(1):5. doi: 10.1186/1939-8433-6-5. - DOI - PMC - PubMed
    1. Lee BM, Park YJ, Park DS, Kang HW, Kim JG, Song ES, Park IC, Yoon UH, Hahn JH, Koo BS, et al. The genome sequence of Xanthomonas oryzae pathovar oryzae KACC10331, the bacterial blight pathogen of rice. Nucleic Acids Res. 2005;33(2):577–86. doi: 10.1093/nar/gki206. - DOI - PMC - PubMed

Publication types

MeSH terms