. 2016 Aug;23(4):447-458.
doi: 10.1177/1073191116648209.

Bridging the Nomothetic and Idiographic Approaches to the Analysis of Clinical Data

Affiliations

Bridging the Nomothetic and Idiographic Approaches to the Analysis of Clinical Data

Adriene M Beltz et al. Assessment. 2016 Aug.

Abstract

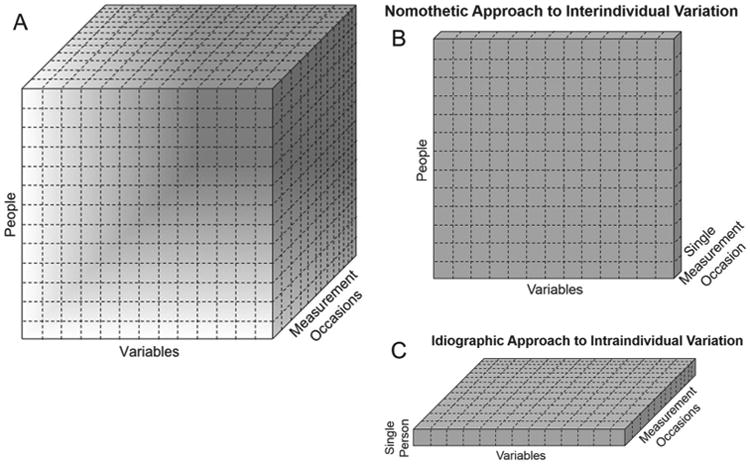
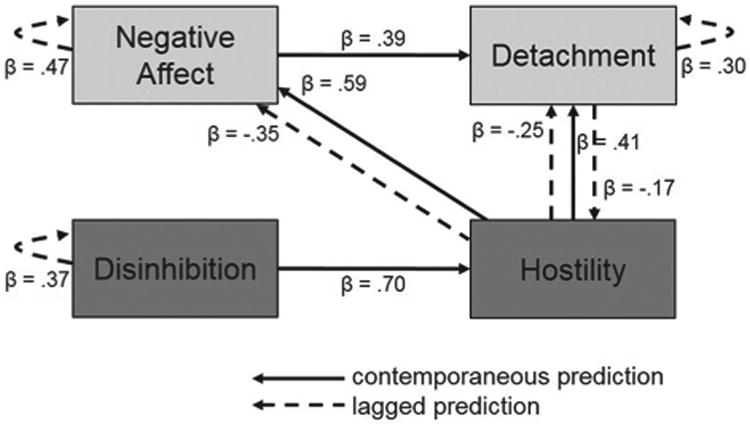
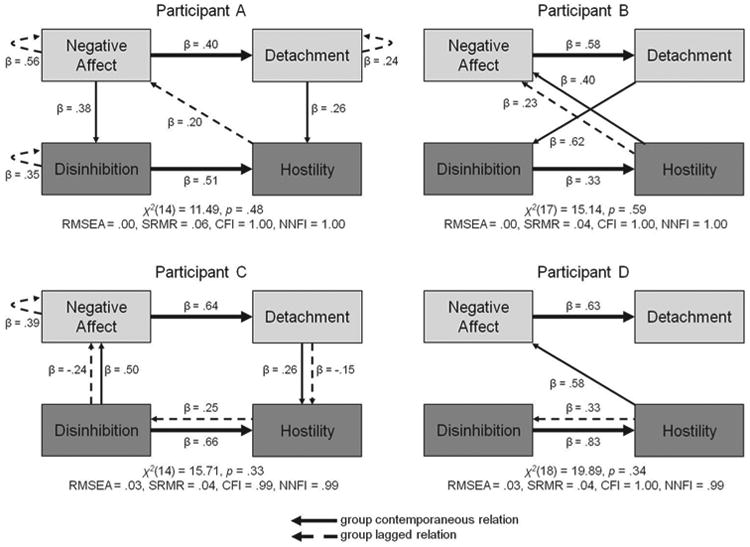
The nomothetic approach (i.e., the study of interindividual variation) dominates analyses of clinical data, even though its assumption of homogeneity across people and time is often violated. The idiographic approach (i.e., the study of intraindividual variation) is best suited for analyses of heterogeneous clinical data, but its person-specific methods and results have been criticized as unwieldy. Group iterative multiple model estimation (GIMME) combines the assets of the nomothetic and idiographic approaches by creating person-specific maps that contain a group-level structure. The maps show how intensively measured variables predict and are predicted by each other at different time scales. In this article, GIMME is introduced conceptually and mathematically, and then applied to an empirical data set containing the negative affect, detachment, disinhibition, and hostility composite ratings from the daily diaries of 25 individuals with personality pathology. Results are discussed with the aim of elucidating GIMME's potential for clinical research and practice.

Keywords: connectivity map; group iterative multiple model estimation; idiographic; interindividual variation; intraindividual variation; nomothetic; personality disorder.


Conflict of interest statement

The author(s) declared no potential conflicts of interest with respect to the research, authorship, and/or publication of this article.

Figures

Figure 1
Figure 1
A Cattell (1952; see also Ram & Nesselroade, 2007) data box illustrating the structure of data from multiple people, variables, and measurement occasions (i.e., time points). (A) A complete data box contains data from all people, variables, and measurement occasions; these data can be analyzed with GIMME (Gates & Molenaar, 2012), which accurately models both inter- and intraindividual variation. (B) A single coronal slice of the data box contains data from all people and variables at a single measurement occasion; these data can be analyzed with nomothetic analyses of interindividual variation that permit inferences about the population if people are homogeneous. (C) A single axial slice of the data box contains data from all variables and measurement occasions for a single person; these data can be analyzed with idiographic analyses of intraindividual variation that assume people are heterogeneous across time.
Figure 2
Figure 2
Results of an idiographic analysis implementing a unified structural equation model (Gates et al., 2010; Kim et al., 2007) on a single participant's composite daily reports of negative affect and detachment (in light gray, reflecting internalizing problems) and disinhibition and hostility (in dark gray, reflecting externalizing problems). Variation is explained by contemporaneous (solid arrows) and lagged (dashed arrows) relations among the facets. For example, today's negative affect is predicted by yesterday's negative affect and hostility as well as today's hostility. Note. Reproduced from Wright, Beltz, et al. (2015).
Figure 3
Figure 3
Four final person-specific maps produced by GIMME-MS analysis of the example data set, containing the optimal group-level structure from the first solution; see Figure S1 and Table 1. All maps fit the data well, contain only significant relations at p ≤ .05, and have white noise residuals indicating that temporal dependencies are sufficiently accounted for in the maps; models specifying that residuals were unrelated across time fit the data well: (A): χ2(126) = 88.63, p = 1.00, RMSEA = .00, SRMR = .09, CFI = 1.00, NNFI = 1.00. (B): χ2(126) = 93.53, p = .99, RMSEA = .00, SRMR = .07, CFI = 1.00, NNFI = 1.00. (C): χ2(126) = 74.94, p = 1.00, RMSEA = .00, SRMR = .07, CFI = 1.00, NNFI = 1.00. D: χ2(126) = 86.21, p = 1.00, RMSEA = .00, SRMR = .07, CFI = 1.00, NNFI = 1.00. Note. GIMME-MS = GIMME for multiple solutions; RMSEA = root mean square error of approximation; SRMR = standardized root mean square residual; CFI = comparative fit index; NNFI = non-normed fit index.

Similar articles

Cited by

References

    1. Akaike H. A new look at the statistical model identification. IEEE Transactions on Automatic Control, AC. 1974;19:716–723.
    1. Beltz AM, Beekman C, Molenaar PCM, Buss KA. Mapping temporal dynamics in social interactions with unified structural equation modeling: A description and demonstration revealing time-dependent sex differences in play behavior. Applied Developmental Science. 2013;17:152–168. - PMC - PubMed
    1. Beltz AM, Gates KM, Engels AS, Molenaar PCM, Pulido C, Turrisi R, et al. Wilson SJ. Changes in alcohol-related brain networks across the first year of college: A prospective pilot study using fMRI effective connectivity mapping. Addictive Behaviors. 2013;38:2052–2059. - PMC - PubMed
    1. Beltz AM, Molenaar PCM. A posteriori model validation for the temporal order of directed functional connectivity maps. Frontiers in Neuroscience. 2015;9:304. - PMC - PubMed
    1. Beltz AM, Molenaar PCM. Dealing with multiple solutions in structural vector autoregressive models. Multivariate Behavioral Research in press. - PubMed

Publication types