. 2016 May 11:7:11445.
doi: 10.1038/ncomms11445.

Caloric restriction blocks neuropathology and motor deficits in Machado-Joseph disease mouse models through SIRT1 pathway

Affiliations

Caloric restriction blocks neuropathology and motor deficits in Machado-Joseph disease mouse models through SIRT1 pathway

Janete Cunha-Santos et al. Nat Commun. .

Abstract

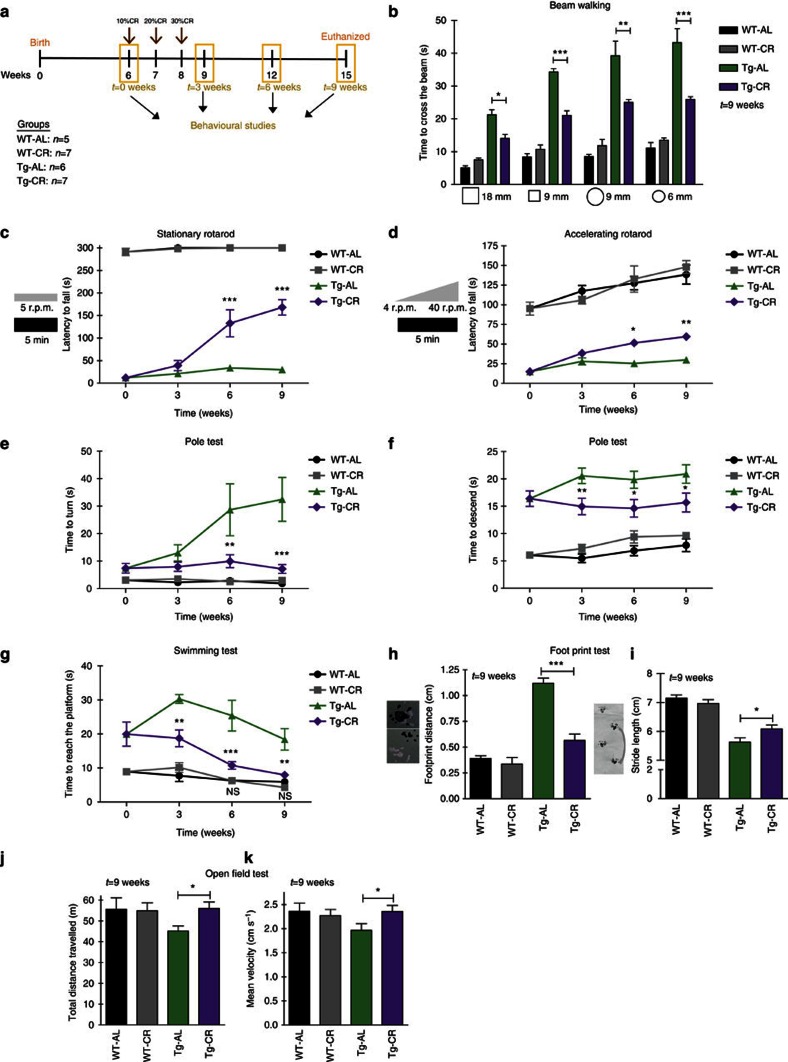
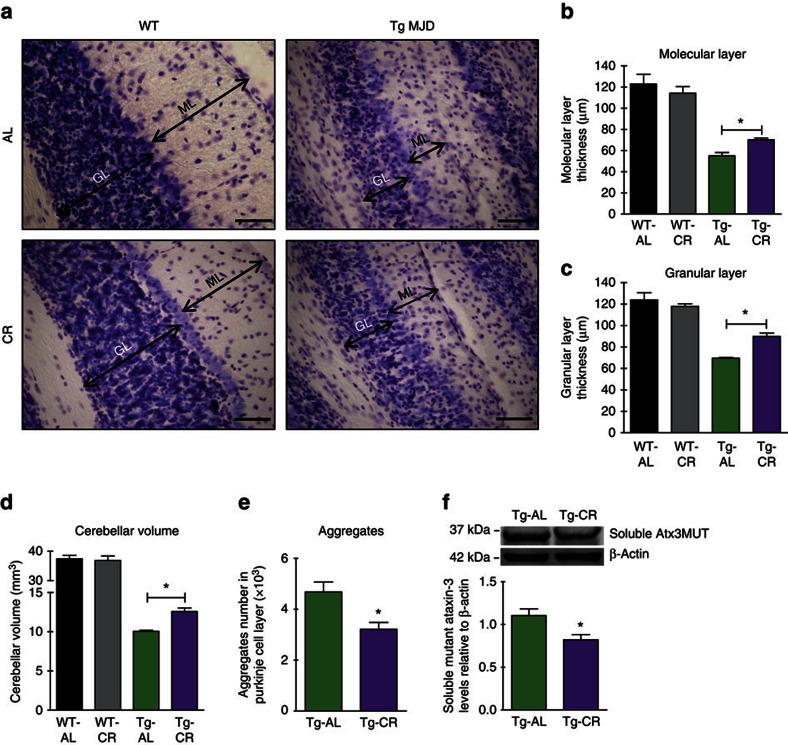
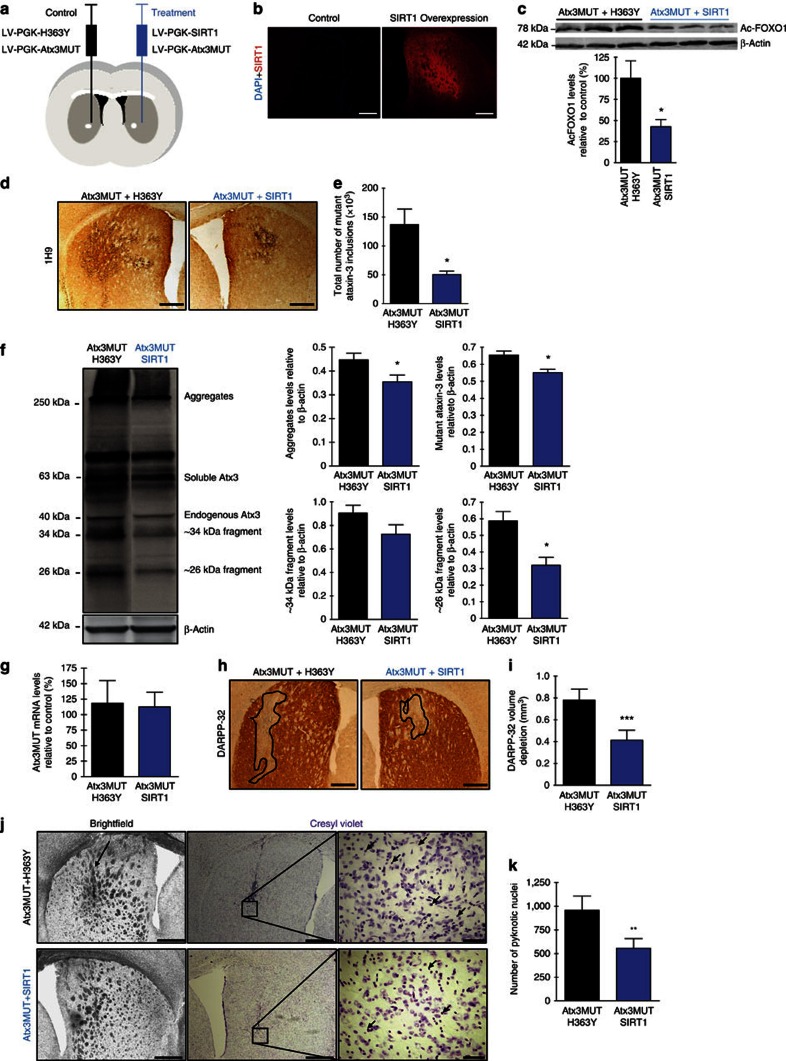
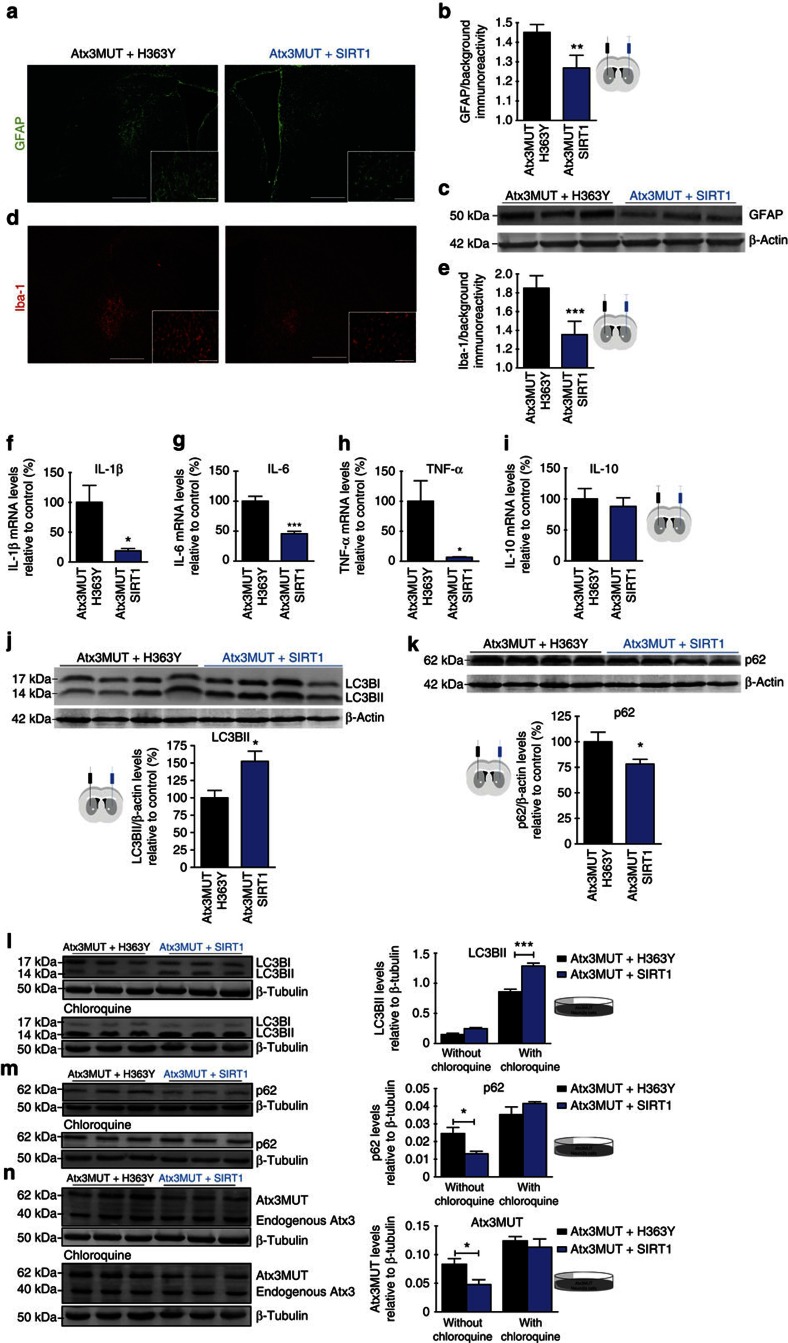
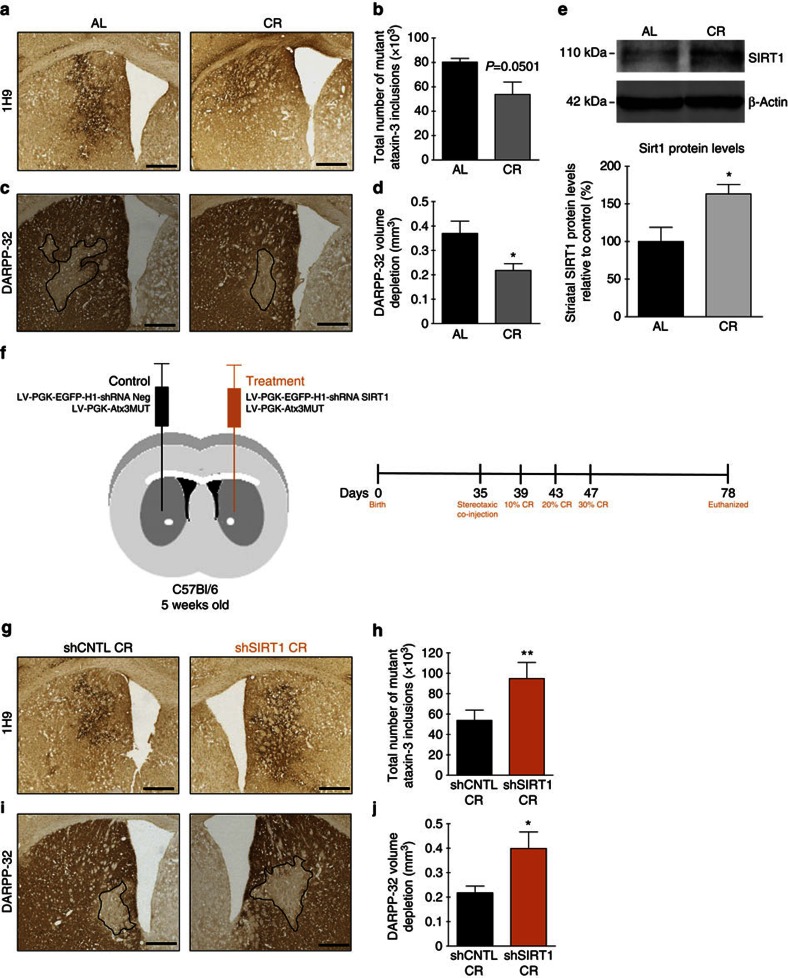
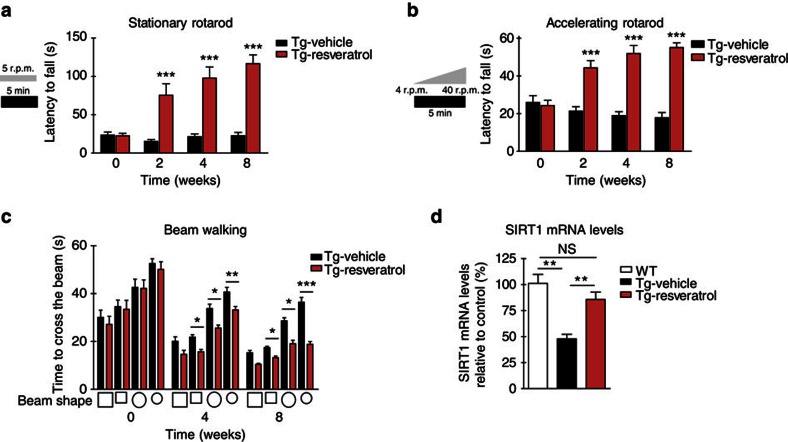
Machado-Joseph disease (MJD) is a neurodegenerative disorder characterized by an abnormal expansion of the CAG triplet in the ATXN3 gene, translating into a polyglutamine tract within the ataxin-3 protein. The available treatments only ameliorate symptomatology and do not block disease progression. In this study we find that caloric restriction dramatically rescues the motor incoordination, imbalance and the associated neuropathology in transgenic MJD mice. We further show that caloric restriction rescues SIRT1 levels in transgenic MJD mice, whereas silencing SIRT1 is sufficient to prevent the beneficial effects on MJD pathology. In addition, the re-establishment of SIRT1 levels in MJD mouse model, through the gene delivery approach, significantly ameliorates neuropathology, reducing neuroinflammation and activating autophagy. Furthermore, the pharmacological activation of SIRT1 with resveratrol significantly reduces motor incoordination of MJD mice. The pharmacological SIRT1 activation could provide important benefits to treat MJD patients.


Figures

Figure 1
Figure 1. CR alleviates balance and motor coordination impairments and ameliorates gait and locomotor activity in a Tg MJD mouse model.
(a) Representative study design; 6-week-old Tg and WT littermate mice were divided in two groups: AL group (AL) and calorie-restricted group (CR). Every 3 weeks, behavioural tests were performed, until animals were 15 weeks old. (b) Beam walking test demonstrating an amelioration of the motor performance of calorie-restricted mice, 9 weeks after the beginning of CR diet. (c,d) Tg MJD mice in CR diet had better performance in constant velocity (5 r.p.m.) and accelerated (from 4 to 40 r.p.m.) rotarod, compared with Tg MJD AL mice. (e,f) Vertical pole test. Since the sixth week, calorie-restricted Tg MJD mice turned downwards easier than the Tg mice in the AL diet (e) and descended the beam with less difficulties (f). (g) Swimming test performance. Since the sixth week, Tg mice exhibited a rescue of the common improper performance in the swimming pool. (h,i) Quantitative analysis of the footprint patterns. Calorie-restricted mice had a higher stride length and a more perfect footprint overlap and their performance is significantly closer to WT performance, 9 weeks after the beginning of CR diet. (j,k) Open-field test. Calorie-restricted Tg MJD mice travelled the same distance and with the same mean velocity than WT mice. Calorie-restricted mice had a higher stride length and a more perfect footprint overlap, and their performance is significantly closer to WT performance, 9 weeks after the beginning of CR diet. Data represent mean±s.e.m.; NS P>0.05, *P<0.05, **P<0.01 and ***P<0.001 compared with Tg-AL. (bg) Two-way analysis of variance (ANOVA) with Bonferroni's post-hoc test. (hk) One-way ANOVA with Bonferroni's post-hoc test. WT-AL n=5; WT-CR n=7; Tg-AL n=6; Tg-CR n=7. See also Supplementary Fig. 1.
Figure 2
Figure 2. Nine weeks of CR prevents cerebellar neuropathology in Tg MJD mice.
(a) Cresyl violet-stained sections demonstrate the thickness of molecular layer (ML) and granular layer (GL) of lobule V of cerebellum in 15-week-old littermate WT and Tg MJD mice in AL or CR diet, quantified in b and c. Scale bar, 50 μm. (d) Quantification of cerebellar volume showed a significantly higher cerebellar volume in calorie-restricted mice. (e) Analysis of the number of mutant ataxin-3 inclusions in the cerebellar Purkinje cells of Tg MJD mice. The total number of aggregates in Purkinje cells is significantly lower in calorie-restricted mice, in comparison with AL mice. (f) Relative levels of the soluble form of mutant ataxin-3 normalized with β-actin were significantly decreased in Tg mice in the CR diet. Data represent mean±s.e.m.; NS P>0.05 and *P<0.05 compared with Tg-AL. (bd). One-way analysis of variance with Bonferroni's post-hoc test. (e,f) Unpaired Student's t-test. WT-AL n=3; WT-CR n=4; Tg-AL n=4; Tg-CR n=4.
Figure 3
Figure 3. SIRT1 levels are abnormally reduced in the cerebellum of MJD Tg mouse model and CR re-establishes normal SIRT1 cerebellar levels.
(a) SIRT1 is compromised in the cerebellum of Tg MJD mice. A significant decrease of 58.4±8.3% in mRNA levels of SIRT1 was detected. These results were supported by western blotting in (b). Data represent mean±s.e.m.; NS P>0.05 and *P<0.05 compared with Tg-AL. (a,b) WT n=5; Tg-AL n=5; Tg-CR n=4. SIRT1.1 (SIRT1 isoform 1) and SIRT1.2 (SIRT1 isoform 2). See also Supplementary Fig. 2.
Figure 4
Figure 4. SIRT1 overexpression reduces mutant ataxin-3 toxicity and neuronal dysfunction in a striatal lentiviral model of MJD.
(a) Schematic representation of the strategy used to create in vivo striatal lentiviral model of MJD and to overexpress SIRT1/H363Y. Five-week-old C57Bl/6J mice were bilaterally injected with lentiviral vectors encoding for mutant ataxin-3. In the left hemisphere were co-injected lentiviral vectors encoding for H363Y and in the right hemisphere for SIRT1. Four weeks after the surgery, mice were euthanized. (b) SIRT1 immunoreactivity in the striatum of animals of the striatal lentiviral model of MJD co-injected with H363Y or SIRT1 versus a control animal. DAPI, blue, nuclei. Scale bar, 500 μm. (c) Acetylated Forkhead box protein O1 (FOXO1) levels are significantly lower in the striata of lentiviral model of MJD when the active form of SIRT1 was overexpressed, in comparison with control side where the inactive form of SIRT1 was overexpressed. (d) With an anti-ataxin-3 antibody (Ab 1H9), total number of mutant ataxin-3 inclusions were counted and are quantified in e. Scale bar, 500 μm. (f) Western blot analysis demonstrated that SIRT1 overexpression significantly reduced several toxic forms of mutant ataxin-3, namely aggregates, soluble form and ∼34 and ∼26 kDa fragments. (g) Quantitative reverse transcriptase–PCR analysis of Atx3MUT mRNA. (h) DARPP-32 staining revealed a major loss of DARPP-32 immunoreactivity in the striatal hemisphere co-infected with mutant ataxin-3 and H363Y. Scale bar, 500 μm. This was quantified in i as depleted volume of DARPP-32 staining. (j) Cresyl violet staining indicating pyknotic nuclei in both hemispheres. A higher number of pyknotic nuclei were visible around the injection site area in the H363Y-transduced hemisphere. Scale bar, 500 μm (brightfield and left cresyl violet) and 50 μm (right cresyl violet). This was quantified in k. Data represent mean±s.e.m. *P<0.05, **P<0.01 and ***P<0.001 compared with non-treated hemisphere. (c,eg,i,k) Paired Student's t-test. n=4.
Figure 5
Figure 5. SIRT1 overexpression reduces MJD-associated neuroinflammation and activates autophagy.
(ae) Quantitative analysis of glial fibrillary acidic protein (GFAP) and ionized calcium binding adaptor molecule 1 (Iba-1) immunoreactivity at 4 weeks after the co-injection of the viral vectors in the striatal lentiviral model of MJD. (ac) SIRT1 decreased astrocytic activation induced by mutant ataxin-3, evidenced by the decrease in GFAP immunoreactivity and by the reduction in GFAP protein levels, evaluated by western blotting in c. (d,e) SIRT1 reduced microglia recruitment triggered by mutant ataxin-3, supported by the decrease of Iba-1 immunoreactivity, in comparison with the control hemisphere. Scale bar, 500 μm in larger images and 100 μm in smaller images. (fi) mRNA levels of inflammatory cytokines were evaluated by quantitative reverse transcriptase–PCR. (fh) mRNA levels of pro-inflammatory IL-1β, IL-6 and TNF-α cytokines were significantly decreased in the hemisphere where SIRT1 was overexpressed. (i) mRNA levels of anti-inflammatory IL-10 cytokine were not changed with SIRT1 overexpression. (j,k) SIRT1 overexpression activates autophagic flux in the striatum of striatal lentiviral model of MJD. (j) SIRT1 overexpression induces an increase in LC3BII levels, in comparison with the overexpression of H363Y. (k) SIRT1 overexpression reduces significantly p62 levels, in comparison with the hemisphere where H363Y was overexpressed. (ln) Neuro 2a cells were co-infected with lentivirus encoding for mutant ataxin-3 and for H363Y (control condition) or co-infected with lentivirus encoding for mutant ataxin-3 and for SIRT1. (l) SIRT1 overexpression in the presence or absence of an autophagic flux inhibitor increased LC3BII levels. (m) In the absence of chloroquine, p62 levels were increased and did not change in the presence of the lysosomal inhibitor. (n) Mutant ataxin-3 levels were reduced when SIRT1 was overexpressed in the cells, in the absence of chloroquine. In the presence of chloroquine, the changes were not observed. Data represent mean±s.e.m. *P<0.05 , **P<0.01 and ***P<0.001 compared with control. (b,ek). Paired Student's t-test. n=4. (ln) Two-way analysis of variance with Bonferroni's post-hoc test. n=4. See also Supplementary Figs 3–5.
Figure 6
Figure 6. CR alleviates MJD neuropathology by the SIRT1 pathway in striatal lentiviral model of MJD.
(a) Mutant ataxin-3 aggregates counting, quantified in b, showed that CR decreased mutant ataxin-3 inclusions in the striatum. Scale bar, 500 μm. (c) A higher DARPP-32 volume depletion, quantified in d, was observed in animals in an AL diet, compared with calorie-restricted mice. Scale bar, 500 μm. (e) Immunoblotting demonstrating that calorie-restricted mice have an increase in the protein levels of SIRT1 in striatum in comparison with AL mice. (f) Schematic representation of the study. Five-week-old C57Bl/6J mice were stereotaxically injected in the striatum. In each hemisphere we injected lentiviral vectors encoding for mutant ataxin-3; in the left hemisphere was co-injected lentiviral vectors encoding for the shRNA control and in the right hemisphere was co-injected lentiviral vectors encoding for the shRNA targeting SIRT1. Four days after the surgeries, animals were divided in two groups. One group of mice was maintained in an AL diet and the other was in a CR diet. (g) Mutant ataxin-3 inclusions counting showed that SIRT1 silencing prevented the decrease in the number of inclusions induced by CR. This was quantified in h. Scale bar, 500 μm. (i) DARPP-32 staining revealed that genetic silencing of SIRT1 in the striatal lentiviral model of MJD induced a blockage of the benefits of CR. This was quantified in j. Scale bar, 500 μm. Data represent mean±s.e.m.; *P<0.05 and **P<0.01 compared with control. (b,d,e) Unpaired Student's t-test. n=5. (h,j) Paired Student's t-test. n=5.
Figure 7
Figure 7. Peripheral administration of resveratrol ameliorates motor deficits and restores SIRT1 mRNA levels in Tg MJD mice.
(a,b) Resveratrol-treated Tg MJD mice showed a significant better performance in constant velocity (5 r.p.m.) and accelerated (from 4 to 40 r.p.m.) rotarods, since the second week of treatment (eighth week after birth), compared with vehicle-treated Tg MJD mice. (c) Beam walking test with two square beams (18 or 9 mm width) and two round beams (9 or 6 mm diameter), demonstrating an amelioration of the motor performance promoted by resveratrol. (d) SIRT1 mRNA levels are decreased in Tg MJD animals (Tg-Vehicle) in comparison with WT mice (WT). SIRT1 mRNA levels are re-established with 8 weeks of daily treatment with 10 mg kg−1 body weight of resveratrol (Tg-Resveratrol). Data represent mean±s.e.m. (ac) NS, nonsignificant; *P<0.05, **P<0.01 and ***P<0.001 compared with Tg vehicle-treated mice. Two-way analysis of variance (ANOVA) with Bonferroni's post-hoc test. Unpaired Student's t-test. n=8–9. (d) Data represent mean±s.e.m. NS. P>0.05 and **P<0.01. Relative to WT mice. One-way ANOVA with Bonferroni's post-hoc test. WT: n=6; Tg-Vehicle: n=5; Tg-Resveratrol: n=5.

Similar articles

Cited by

References

    1. Haberhausen G., Damian M. S., Leweke F. & Muller U. Spinocerebellar ataxia, type 3 (SCA3) is genetically identical to Machado-Joseph disease (MJD). J. Neurol. Sci. 132, 71–75 (1995). - PubMed
    1. Kawaguchi Y. et al.. CAG expansions in a novel gene for Machado-Joseph disease at chromosome 14q32.1. Nat. Genet. 8, 221–228 (1994). - PubMed
    1. Coutinho P. & Andrade C. Autosomal dominant system degeneration in Portuguese families of the Azores Islands. a new genetic disorder involving cerebellar, pyramidal, extrapyramidal and spinal cord motor functions. Neurology 28, 703–709 (1978). - PubMed
    1. Sequeiros J. et al.. Genetic linkage studies of Machado-Joseph disease with chromosome 14q STRPs in 16 Portuguese-Azorean kindreds. Genomics 21, 645–648 (1994). - PubMed
    1. Durr A. et al.. Spinocerebellar ataxia 3 and Machado-Joseph disease: clinical, molecular, and neuropathological features. Ann. Neurol. 39, 490–499 (1996). - PubMed

Publication types

MeSH terms