. 2016 May 9;29(5):669-683.
doi: 10.1016/j.ccell.2016.03.027.

Olig2-Dependent Reciprocal Shift in PDGF and EGF Receptor Signaling Regulates Tumor Phenotype and Mitotic Growth in Malignant Glioma

Affiliations

Olig2-Dependent Reciprocal Shift in PDGF and EGF Receptor Signaling Regulates Tumor Phenotype and Mitotic Growth in Malignant Glioma

Fanghui Lu et al. Cancer Cell. .

Abstract

Malignant gliomas exhibit extensive heterogeneity and poor prognosis. Here we identify mitotic Olig2-expressing cells as tumor-propagating cells in proneural gliomas, elimination of which blocks tumor initiation and progression. Intriguingly, deletion of Olig2 resulted in tumors that grow, albeit at a decelerated rate. Genome occupancy and expression profiling analyses reveal that Olig2 directly activates cell-proliferation machinery to promote tumorigenesis. Olig2 deletion causes a tumor phenotypic shift from an oligodendrocyte precursor-correlated proneural toward an astroglia-associated gene expression pattern, manifest in downregulation of platelet-derived growth factor receptor-α and reciprocal upregulation of epidermal growth factor receptor (EGFR). Olig2 deletion further sensitizes glioma cells to EGFR inhibitors and extends the lifespan of animals. Thus, Olig2-orchestrated receptor signaling drives mitotic growth and regulates glioma phenotypic plasticity. Targeting Olig2 may circumvent resistance to EGFR-targeted drugs.


Figures

Figure 1
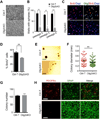
Figure 1. Olig2 expression in mitotic progenitors in human and mouse GBM
(A) A representative image showing OLIG2 (brown) expression in human proneural (PN) GBMs. (B) Human PN GBM sections immunostained with OLIG2 (red) and Ki67, SOX2, POU3F2, or CD133 as indicated (green). Arrows indicate co-labeled cells. (C) The percentage of labeling-positive cells among OLIG2+ cells in proneural GBMs (n = 6 individual tumors; > 250 cell counts/tumor tissue). (D) Left: PDGFB-Cre retrovirus injection into the cerebral white matter of 8-week old adult Ptenfl/fl;Trp53fl/fl mice. Right: Hematoxylin and eosin (H&E)-stained brain section showing malignant glioma at dpi 24. (E) Olig2 expression (brown) in PDGFB-Cre-induced glioma lesion. (F–H) Glioma lesions were immunostained with Olig2 (red) and (F) Ki67, (G) Sox2, or (H) Pou3f2 (green). (I) The percentage of co-labeled cells among Olig2+ cells in tumor lesions. (n = 5 animals; > 250 cell counts/tumor tissue). Scale bars in A–B, E–H, 50 µm; D, 1 mm. Data are presented as mean ± S.E.M. in C and I. See also Figure S1.
Figure 2
Figure 2. Ablation of mitotic Olig2+ cells inhibits glioma formation
(A) Schematic design for Olig2-TK knock-in mice. The line below the Olig2 locus represents the 5’ external probe for Southern analysis. H, HindIII site; neo, neomycin cassette; Frt, flippase recognition targets; DTA, diphtheria toxin gene. (B) Southern blot analysis of Olig2-TK knock-in with 5’ Olig2 probe using HindIII digested DNA. The 3.2 and 5-kb bands correspond to the knock-in and wild-type alleles, respectively. (C) Immunostaining of TK and Olig2 in the cortex of P14 Olig2-TK mice. Arrows: co-labeled cells. (D) Schematic diagram showing GCV-mediated depletion of dividing Olig2-TK+ cells that spares post-mitotic Olig2+ cells. (E) Kaplan-Meier survival analysis of GCV-treated control (n = 13) and Olig2-TK (n = 14) mice from dpi 5 (*** p < 0.001 with the log-rank test). (F) H&E-stained brain sections from GCV-treated control and Olig2-TK mice. Arrows: tumor lesions. (G) H&E and Ki67 staining of GCV-treated Ctrl-T mice (top panels) and Olig2-TK mice (bottom panels). (H) Survival analysis of mice treated with GCV starting from dpi 20. Median survival in control group 25 days (n = 7) and in Olig2-TK group (n = 8) 39.5 days (** p < 0.01 with the log-rank test). (I, J) The percentage of Olig2+/Ki67+ cells among Olig2+ cells (I) and of Olig2/Ki67+ cells among Ki67+ cells (J) in control tumors at dpi 5 and dpi 23. Data represent the means ± SEM in tumor tissues from three animals (> 250 cell counts/tumor tissue; * p < 0.05; Student’s t test). Scale bars in C and G, 50 µm; F, 1 mm. See also Figure S2.
Figure 3
Figure 3. Olig2 deletion inhibits the growth of mouse glioma
(A) Representative bioluminescence images of Ctrl-T and Olig2cKO mice during tumor progression. (B) Quantification of bioluminescence signals as a function of time for Ctrl-T and Olig2cKO mice. Data are the means ± SEM (n = 6 animals). (C) H&E staining of brain sections of Ctrl-T and Olig2cKO tumors at dpi 13, 20, and 48. (D) Sections of Ctrl-T and Olig2cKO tumors at dpi 13 were immunostained with Olig2, BrdU, and Sox2 after a 2-hr BrdU pulse labeling. (E) Sections of Ctrl-T and Olig2cKO tumors at dpi 10 and dpi 20 immunostained for BrdU (green) after a 2-hr BrdU pulse labeling. DAPI in blue. (F) Percentage of BrdU+ cells in Ctrl-T and Olig2cKO tumors at dpi 10 and dpi 20. Data represent the means ± SEM from three independent experiments (** p < 0.01; Student’s t test). (G) Survival analysis of Ctrl-T and Olig2cKO mice. Median survival in Ctrl-T group (n = 18): 25 days; in Olig2cKO group (n = 37): 48 days (*** p < 0.001 with the log-rank test). Scale bars in C, 1 mm; D, 20 µm. E, 50 µm. See also Figure S3.
Figure 4
Figure 4. Proliferation and differentiation of Olig2cKO tumor cells
(A) Neurosphere formation from Ctrl-T and Olig2cKO tumor cells in serum-free media. Scale bar, 50 µm. (B) Percentage of wells that formed spheres from Ctrl-T and Olig2cKO tumor cells at clonal density in continuous passages. (C) Ctrl-T and Olig2cKO tumor cell cultures were pulse-labeled with BrdU for 1 hr and immunostained with BrdU and Olig2 and counterstained with DAPI. Scale bar, 20 µm. (D) Percentage of BrdU+ Ctrl-T and Olig2cKO tumor cells pulse-labeled with BrdU for 1 hr. (E) Representative images of soft agar colony formation by Ctrl-T and Olig2cKO tumor cells. Scale bar, 1 mm. (F, G) Quantification of colony diameter (F) and colony number (G) from Ctrl-T and Olig2cKO tumor cells, respectively, plated on soft agar. (H) Tumor cells from Ctrl-T and Olig2cKO mice were cultured in 1% FBS for 48 hr and stained with anti-GFAP and anti-PDGFRα as indicated. Scale bar, 50 µm. Data are presented as means ± SEM from three independent experiments in B, D, F and G. The cross-lines in F represent means ± SEM (** p < 0.01; *** p < 0.001; Student’s t test). See also Figure S4.
Figure 5
Figure 5. Olig2cKO tumor cells retain tumorigenic capacity
(A) Tumor cells (1 × 10⁴) isolated from Ctrl-T and Olig2cKO tumor lesions were intracranially engrafted into the striatum of NSG mice. The tumor tissues were stained with H&E and Olig2 as indicated. Arrows indicate tumor tissues. Scale bars in left, middle and right panels; 1 mm, 100 µm and 50 µm, respectively. (B) Kaplan-Meier survival analysis of NSG mice transplanted with 1 × 10⁴ Ctrl-T or Olig2cKO tumor cells or 1 × 10³ Ctrl-T or Olig2cKO tumor cells (p < 0.01 with the log-rank test between control and Olig2cKO group; n ≥ 5 for each group). (C) Representative in vivo bioluminescence imaging of the NSG mice engrafted with 1 × 10⁴ Ctrl-T or Olig2cKO tumor cells carrying the Rosa-tmLuciferase reporter at dpi 16 and dpi 30. (D) Tumor lesions after transplantation of Ctrl-T or Olig2cKO tumor cells were immunostained with Olig2 (red) and BrdU (green) after 2-hr pulse-labeling. Arrows indicate Olig2+ cells. Scale bar, 20 µm. (E) Percentage of BrdU+ cells among Olig2+ or Olig2 cells in Ctrl-T and Olig2cKO orthotopic tumors. Data represent the means ± SEM from three mice per group.
Figure 6
Figure 6. Olig2 targets the enhancers of cell cycle regulators and oncogenes to regulate cell growth
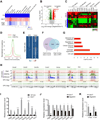
(A) Heatmap showing the patterns of pathway activity among normal cortices (n=3), Ctrl-T tumors (n = 4) and Olig2cKO tumors (n = 6) based on the MSigDB database. Expression signature scores are the means and clustered with linkage hierarchical clustering. (B) Volcano plot of transcriptome expression profiles between the Ctrl-T tumors and Olig2cKO tumors. Red and green dots represent genes significantly up-regulated and downregulated in Olig2cKO tumors (p < 0.05), respectively. (C) Heatmap of the genes differentially expressed and associated with tumorigenesis between Ctrl-T tumors (n = 4) and Olig2cKO tumors (n = 6). (D) Anchor plot of Olig2 and H3K27ac ChIP-seq peaks. (E) Heatmap for signal intensity of Olig2-targeted gene loci in Ctrl-T tumors and NPCs. (F) Venn diagram for Olig2-targeted genes detected by ChIP-seq in tumor tissues and NPCs. (G) GO analysis of biological processes corresponding to Olig2-targeted genes in tumor tissues. (H) Olig2 and histone binding profiles on indicated gene loci in tumor tissues. Olig2 targeting in NPCs and OPCs is shown in the bottom panels. (I) qRT-PCR analysis of candidate gene expression in the wild-type corpus callosum (WT-CC) at 8-week old and Ctrl-T tumor tissues at dpi 20. (J) qRT-PCR analysis of gene expression in Ctrl-T and Olig2cKO tumor tissue. (K) qRT-PCR quantification of c-Myc and c-Jun expression in an early stage (dpi 10) Ctrl-T and Olig2cKO tumors. Data are presented as the means ± SEM from three animals per group in I, J, K (* p < 0.05; ** p < 0.01; *** p < 0.001; Student’s t test).
Figure 7
Figure 7. Olig2 deletion leads to a tumor phenotype shift from proneural to classical expression pattern
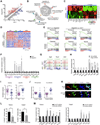
(A) Scatter plot of RNA-seq data from Ctrl-T and Olig2cKO tumors. Examples of significantly (p < 0.05) up-regulated and down-regulated genes in Olig2cKO as compared to Ctrl-T are represented by red and blue dots, respectively. (B) ToppCluster analysis shows associated biological processes of genes enriched in Ctrl-T and Olig2cKO tumors. (C) Heatmap indicating expression levels of the “signature” genes in PN and CL GBMs (Verhaak et al., 2010) that are substantially altered in Olig2cKO tumors as compared to Ctrl-T tumors. (D) Heatmap of the Ctrl-T-enriched genes and Olig2cKO-enriched genes in four subtypes of human GBM taken from TCGA unified CORE datasets. (E) GSEA enrichment plots showing the comparison of gene expression profiles in Ctrl-T and Olig2cKO tumors with the TCGA signature gene sets in PN, CL, mesenchymal (MES) or neural (NL) GBMs as indicated. NES: normalized enrichment score; p value, represents the statistical significance of the enrichment score; FDR: false discovery rate. (F) qRT-PCR analysis of expression of representative PN, CL, MES, and NL signature genes between Ctrl-T and Olig2cKO tumors. (G) Visualization of Olig2 binding profiles on the enhancers (marked by H3K27ac) of representative CL signature genes, Egfr, Tbx2, and Gli2 in Ctrl-T and Olig2cKO tumors. (H) Tumor cells from three different Ctrl-T mice were infected with lentivirus for expression of an shRNA targeting Olig2 or with an shRNA non-target (NT) control for 4 days. The expression of a set of PN and CL genes was analyzed by qRT-PCR. (I) Graph of the relative OLIG2 or EGFR expression (Z-score) in PN and CL subtypes of GBMs from the core TCGA samples using the unified scaled data (*** p < 0.001; Student’s t test). (J) Graph of the relative OLIG2 and EGFR expression in PN or CL subtypes of core TCGA GBMs, respectively. (K) Primary human GBM clonal cells TS543 were transduced with lentiviral non-target or OLIG2 shRNA vectors carrying a GFP reporter for 72 hr and were pulse-labeled with BrdU for 1 hr. Representative images of the cells immunostained with anti-BrdU and OLIG2 are shown. Arrows: transduced cells. Scale bar, 10 µm. (L) Percentage of BrdU+ cells transduced with non-target (NT) control shRNA and OLIG2 shRNA in TS543 (left) and TS667 (right). (M) Primary human proneural GBM clonal cells TS543 (left) and TS667 (right) were infected with lentivirus for non-target (NT) control or OLIG2 shRNA for 84 hr. Expression of a set of proneural and classical tumor associated genes were analyzed by qRT-PCR. Data are presented as the means ± SEM from three independent experiments in F, H, L, and M. The cross-lines in I and J represent means ± SEM (* p < 0.05; ** p < 0.01; *** p < 0.001; Student’s t test). See also Figure S5.
Figure 8
Figure 8. Targeting EGFR signaling suppresses tumor cell proliferation in Olig2cKO mice
(A) Representative immunostaining images of Olig2, PDGFRα, and EGFR in Ctrl-T and Olig2cKO tumors. Scale bar, 50 µm. B) Representative immunostaining images for EGFR, Ki67, and Olig2 in Ctrl-T and Olig2cKO tumors. Scale bar, 20 µm. (C) Representative western blots show expression of PDGFRα, p-PDGFRα, EGFR, p-EGFR in Ctrl-T and Olig2cKO tumors. α-Tubulin as a loading control. (D) Quantification of relative expression of PDGFRα, p-PDGFRα, EGFR, and p-EGFR in Olig2cKO and Ctrl-T tumors. (E) Representative images showing the expression of PDGFRα (red) and Olig2 (green) in Ctrl-T and Olig2cKO tumors. Scale bar, 10 µm. (F) The quantification of PDGFRα+ cells in Ctrl-T and Olig2cKO tumors per unit area (0.04 mm2). (G) Representative images of BrdU (red) immunostaining of Ctrl-T and Olig2cKO tumor cells treated with gefitinib or vehicle (DMSO); Olig2 and DAPI staining was shown in green and blue, respectively. Scale bar, 30 µm. (H) Percentages of BrdU+ cells in Ctrl-T and Olig2cKO tumor cells treated with gefitinib or DMSO. Data represent the means ± SEM from three independent experiments (** p < 0.01; *** p < 0.001; ANOVA with Newman–Keuls multiple comparison test). (I) Quantification of cells using the CellTiter Glo viability assay from Ctrl-T and Olig2cKO tumor cells at indicated times after treatment. Plotted are cell numbers in gefitinib-treated samples divided by cell numbers from DMSO-treated samples. (J) Cleaved Caspase 3 staining (green) in Ctrl-T and Olig2cKO tumor cells after DMSO or gefitinib treatment; Olig2 staining shown in red; DAPI in blue. Scale bar, 30 µm. (K) Percentage of cleaved Caspase 3+ cells in Ctrl-T and Olig2cKO tumor cells treated with gefitinib or DMSO. (L, M) Relative bioluminescence signals in (L) Ctrl-T mice at dpi 15 and dpi 25 and (M) Olig2cKO mice at dpi 30 and dpi 40 treated with DMSO (black) or gefitinib (gray) delivered by osmotic minipumps (n ≥ 6 mice for each group). (N) Representative in vivo bioluminescence images of Ctrl-T and Olig2cKO mice treated with DMSO or gefitinib at indicated time-points post tumor induction. (O) Kaplan-Meier survival analysis of Ctrl-T mice treated with DMSO (brown) or gefitinib (orange), and Olig2cKO mice treated with DMSO (blue) or gefitinib (green) delivered by osmotic minipumps. p < 0.05 with the log-rank test between DMSO or gefitinib treated Olig2cKO mice. n ≥ 5 mice for each group. Data are presented as means ± SEM from at least three independent tumor tissue samples per group in D, F, I, K-M (* p < 0.05; ** p < 0.01; Student’s t test). See also Figure S6.

Comment in

Similar articles

Cited by

References

    1. Barrett LE, Granot Z, Coker C, Iavarone A, Hambardzumyan D, Holland EC, Nam HS, Benezra R. Self-renewal does not predict tumor growth potential in mouse models of high-grade glioma. Cancer Cell. 2012;21:11–24. - PubMed
    1. Bhat KP, Balasubramaniyan V, Vaillant B, Ezhilarasan R, Hummelink K, Hollingsworth F, Wani K, Heathcock L, James JD, Goodman LD, et al. Mesenchymal differentiation mediated by NF-kappaB promotes radiation resistance in glioblastoma. Cancer Cell. 2013;24:331–346. - PMC - PubMed
    1. Brennan CW, Verhaak RG, McKenna A, Campos B, Noushmehr H, Salama SR, Zheng S, Chakravarty D, Sanborn JZ, Berman SH, et al. The somatic genomic landscape of glioblastoma. Cell. 2013;155:462–477. - PMC - PubMed
    1. Cai J, Chen Y, Cai WH, Hurlock EC, Wu H, Kernie SG, Parada LF, Lu QR. A crucial role for Olig2 in white matter astrocyte development. Development. 2007;134:1887–1899. - PubMed
    1. Carro MS, Lim WK, Alvarez MJ, Bollo RJ, Zhao X, Snyder EY, Sulman EP, Anne SL, Doetsch F, Colman H, et al. The transcriptional network for mesenchymal transformation of brain tumours. Nature. 2010;463:318–325. - PMC - PubMed

Publication types

MeSH terms

Substances