Multicenter Study
. 2016 May 9;29(5):723-736.
doi: 10.1016/j.ccell.2016.04.002.

Comprehensive Pan-Genomic Characterization of Adrenocortical Carcinoma

Collaborators, Affiliations
Multicenter Study

Comprehensive Pan-Genomic Characterization of Adrenocortical Carcinoma

Siyuan Zheng et al. Cancer Cell. .

Erratum in

  • Comprehensive Pan-Genomic Characterization of Adrenocortical Carcinoma.
    Zheng S, Cherniack AD, Dewal N, Moffitt RA, Danilova L, Murray BA, Lerario AM, Else T, Knijnenburg TA, Ciriello G, Kim S, Assie G, Morozova O, Akbani R, Shih J, Hoadley KA, Choueiri TK, Waldmann J, Mete O, Robertson AG, Wu HT, Raphael BJ, Shao L, Meyerson M, Demeure MJ, Beuschlein F, Gill AJ, Sidhu SB, Almeida MQ, Fragoso MCBV, Cope LM, Kebebew E, Habra MA, Whitsett TG, Bussey KJ, Rainey WE, Asa SL, Bertherat J, Fassnacht M, Wheeler DA; Cancer Genome Atlas Research Network; Hammer GD, Giordano TJ, Verhaak RGW. Zheng S, et al. Cancer Cell. 2016 Aug 8;30(2):363. doi: 10.1016/j.ccell.2016.07.013. Epub 2016 Aug 8. Cancer Cell. 2016. PMID: 27505681 No abstract available.

Abstract

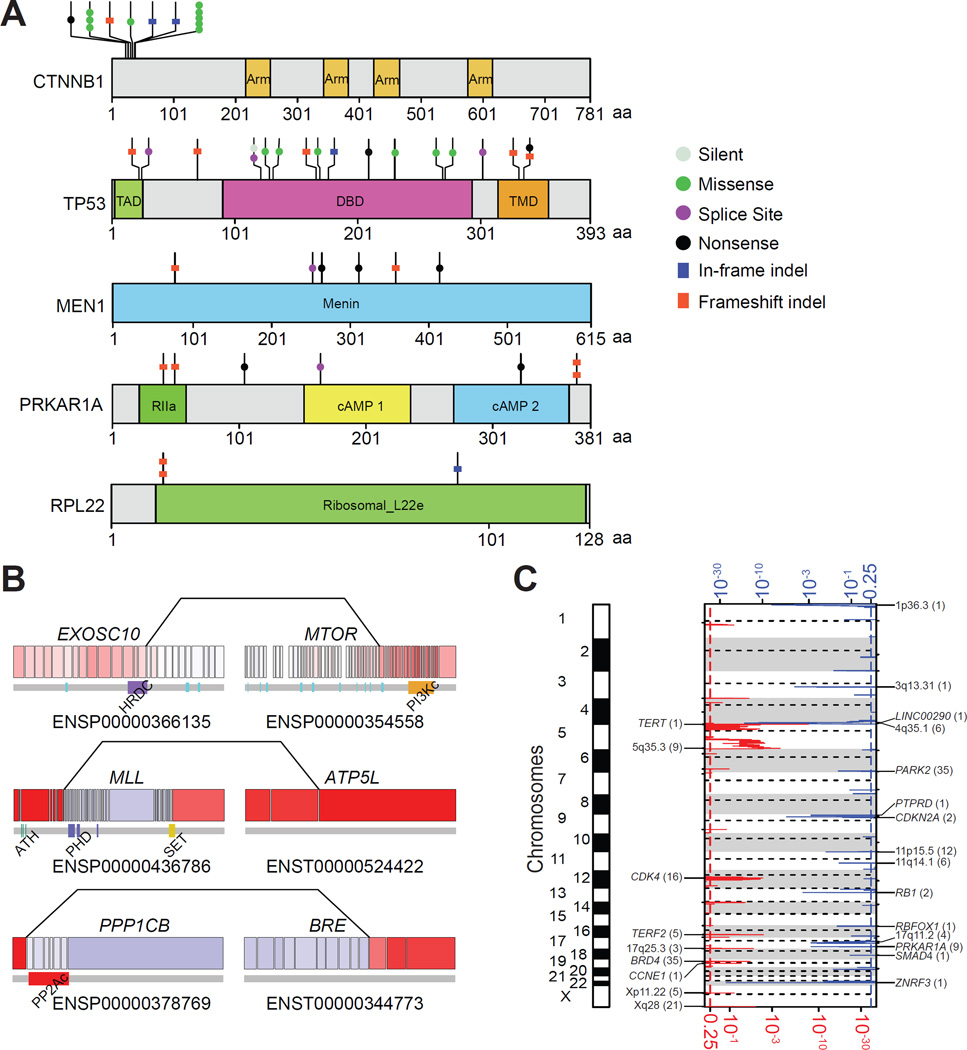
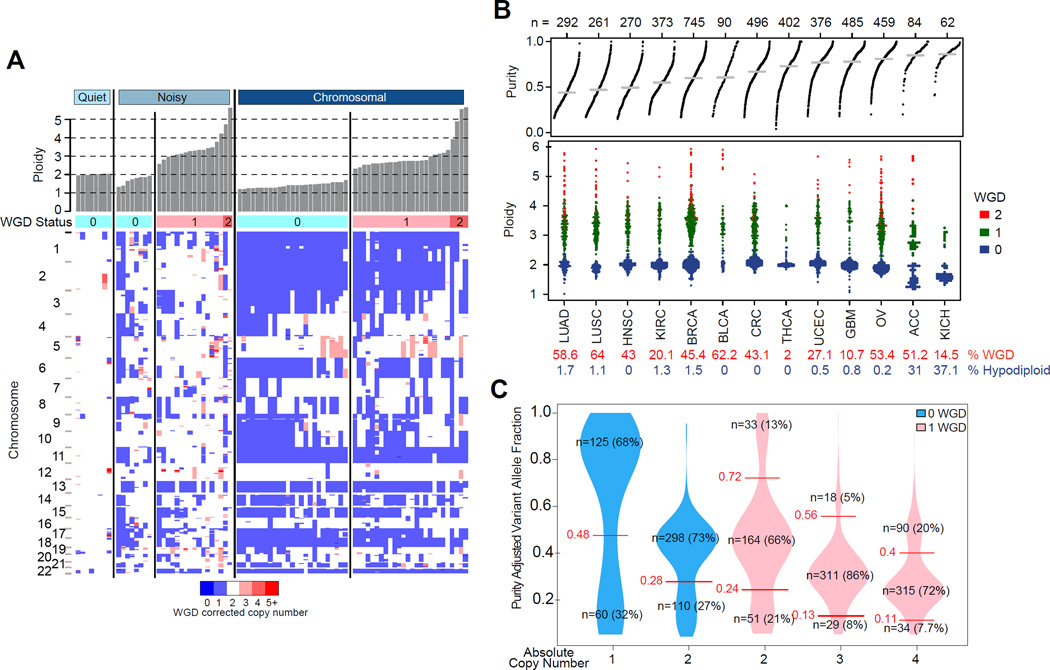
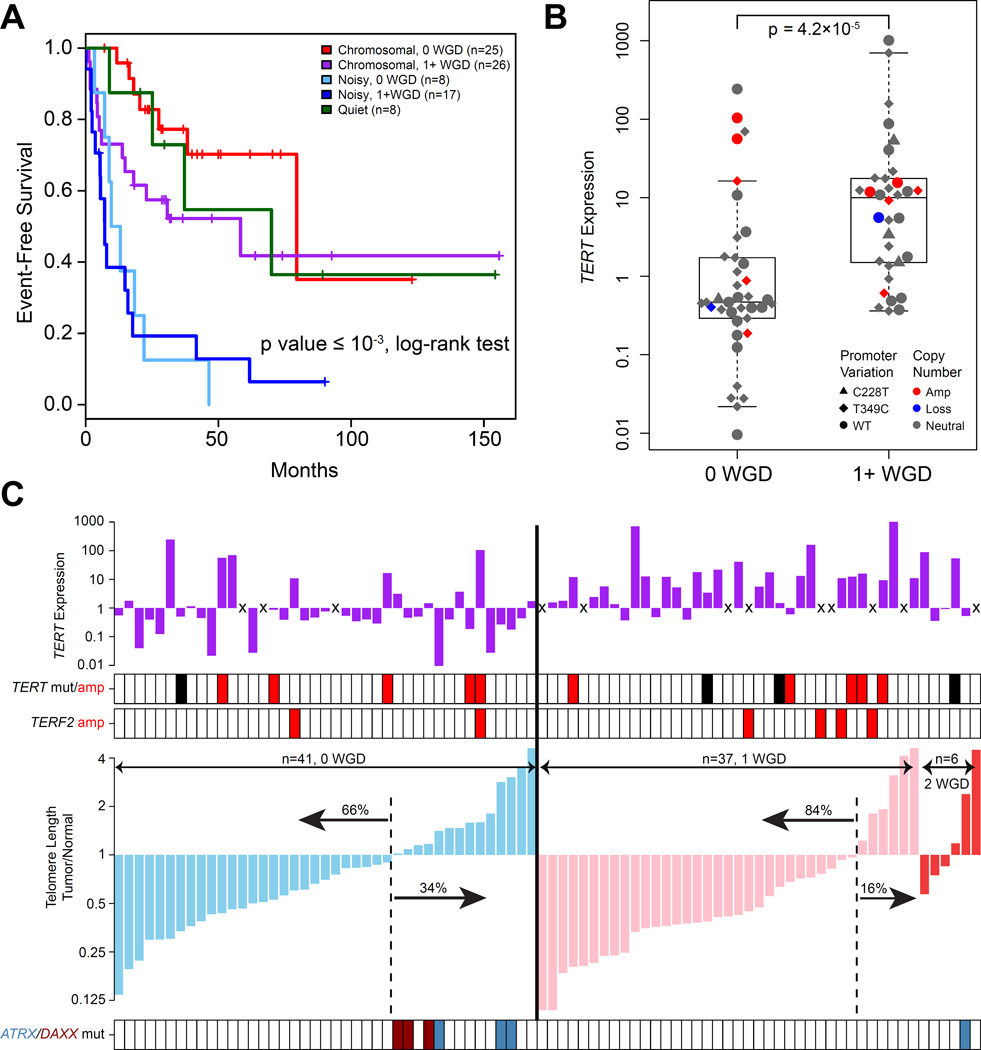
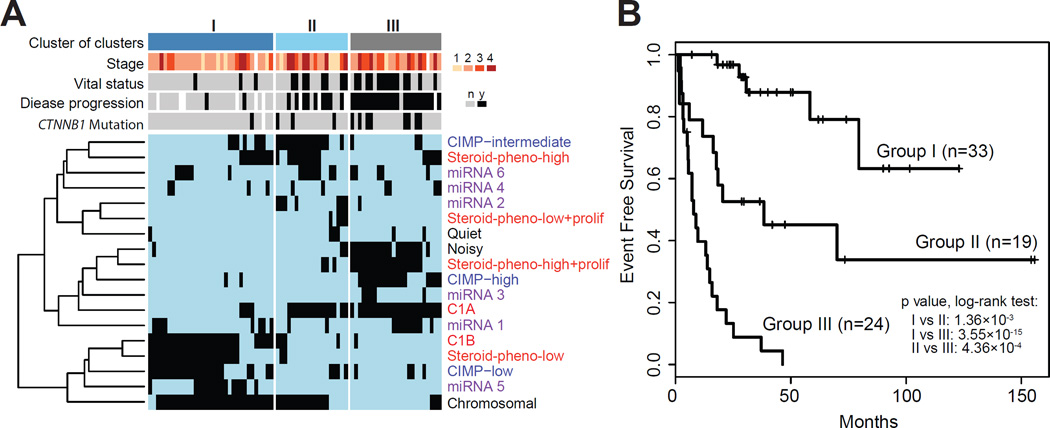
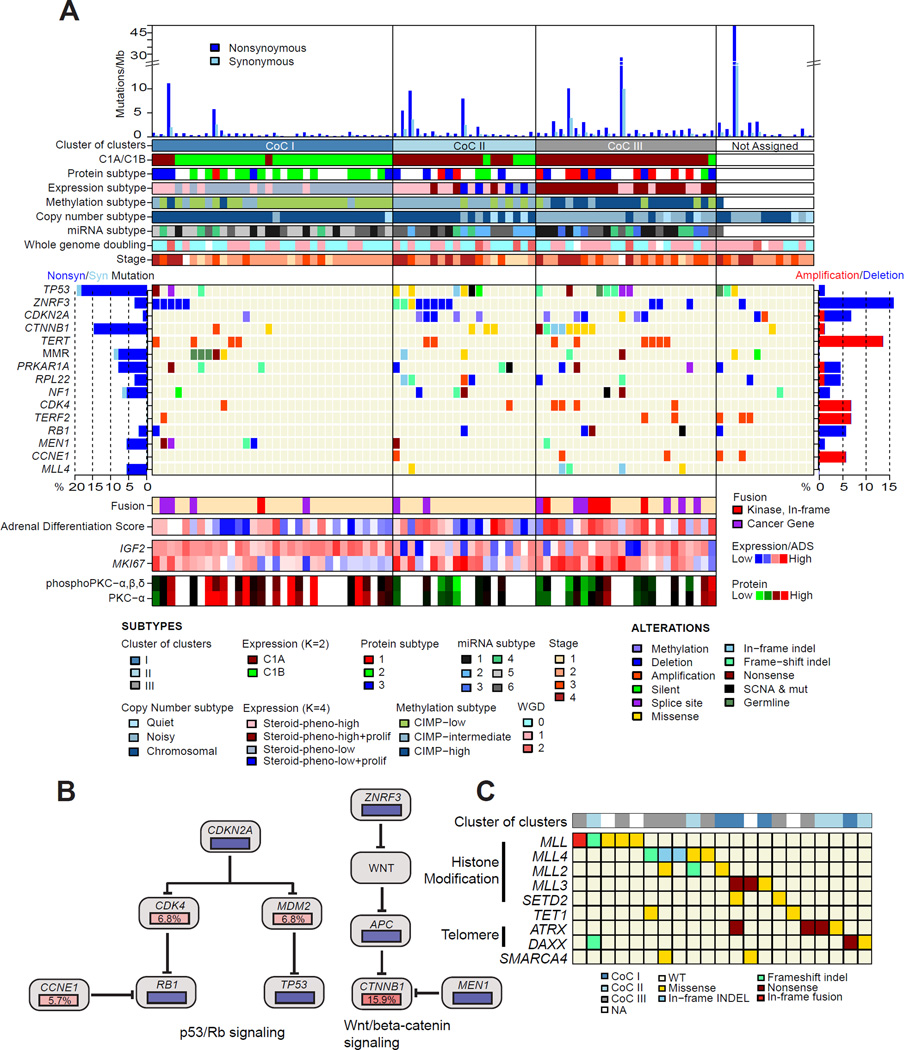
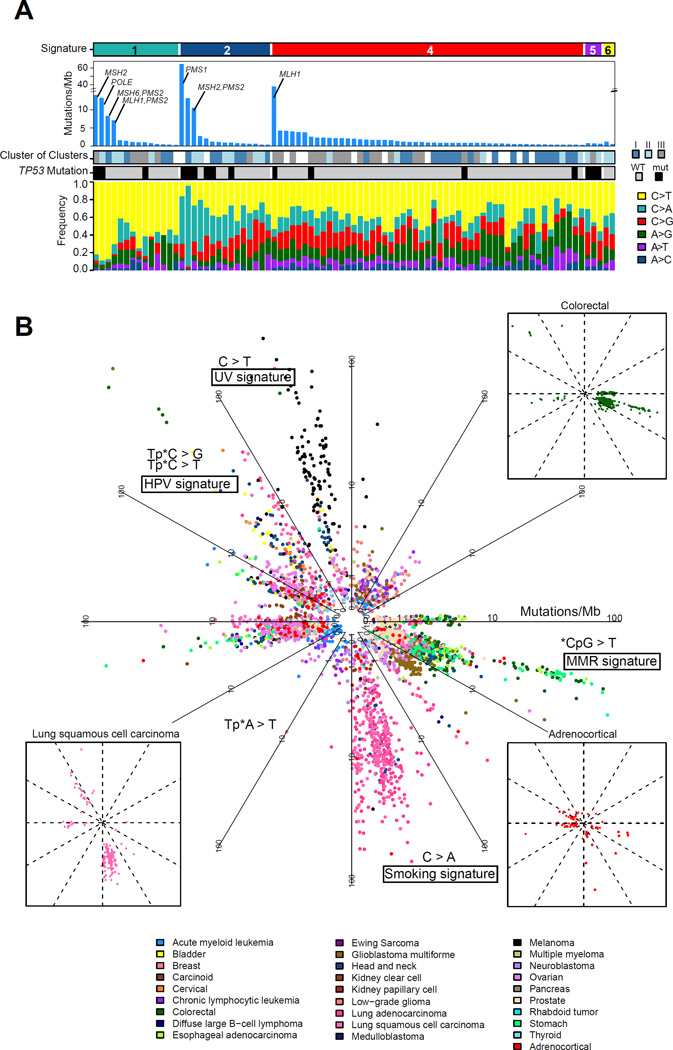
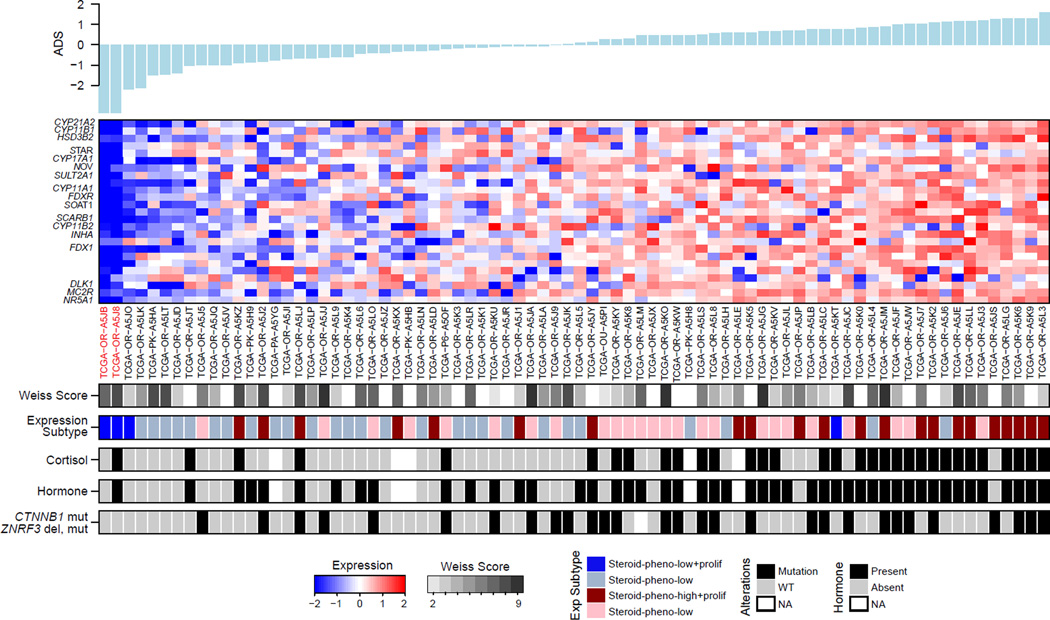
We describe a comprehensive genomic characterization of adrenocortical carcinoma (ACC). Using this dataset, we expand the catalogue of known ACC driver genes to include PRKAR1A, RPL22, TERF2, CCNE1, and NF1. Genome wide DNA copy-number analysis revealed frequent occurrence of massive DNA loss followed by whole-genome doubling (WGD), which was associated with aggressive clinical course, suggesting WGD is a hallmark of disease progression. Corroborating this hypothesis were increased TERT expression, decreased telomere length, and activation of cell-cycle programs. Integrated subtype analysis identified three ACC subtypes with distinct clinical outcome and molecular alterations which could be captured by a 68-CpG probe DNA-methylation signature, proposing a strategy for clinical stratification of patients based on molecular markers.


Figures

Figure 1
Figure 1. Mutational driver genes in ACC
(A) Protein domain structure of the five significantly mutated genes with somatic mutations aligned. Functional domains and mutation types are indicated in different colors and shapes as shown in the legend. Arm, Armadillo domain; TAD, transcription-activation domain; DBD, DNA binding domain; TMD, tetramerisation domain; RIIa, regulatory subunit of type II PKA R-subunit. (B) Sporadic gene fusions that involve cancer genes. All exons are represented, with red and blue indicating high and low expression respectively. Lines linking two exons indicate the fusion positions. Protein domains are related to the exons below the gene diagram. HRDC, helicase and RNase D C-terminal; PI3Kc, phosphoinositide 3-kinase, catalytic domain; ATH, AT-hook motif; PHD, plant homology domain; SET, Su(var)3–9, enhancer-of-zeste, trithorax; PP2Ac, protein phosphatase 2A homologues, catalytic domain. (C) Focal recurrent amplifications and deletions in ACCs with the number of genes spanned by the peak in parentheses. Red and blue indicate amplification and deletion, respectively. The x-axis at the bottom and top of the figure represents significance of amplification/deletion per q-value. See also Figure S1 and Table S1.
Figure 2
Figure 2. Landscape of DNA copy number alteration in ACC
(A) Three major copy number patterns in ACC. Unsupervised clustering divided the cohort (n=89) into quiet, chromosomal and noisy subtypes. (B) Pan-cancer purity and ploidy including ACC. Sample sizes are indicated on top. Average tumor purity is plotted as a grey line for each cancer type. The percentages of whole genome doubling and hypodiploidy (ploidy ≤1.6) are listed in red and blue, respectively. LUAD - lung adenocarcinoma; LUSC – lung squamous; HNSC – head and neck; KIRC – clear cell renal cell; BRCA – breast; BLCA – bladder; CRC – colorectal; THCA – thyroid papillary; UCEC – endometrial; GBM – glioblastoma; OV – ovarian; KICH – kidney chromophobe. (C) Purity adjusted variant allele fraction in genome doubled and undoubled tumors. Only tumors with high purity (≥0.8) and mutation density less than 5 were included. Cutoffs labeled in the figure are recognized as turning points in the density distributions of variant allele fractions. See also Figure S2.
Figure 3
Figure 3. Comparison of WGD and non-WGD ACCs
(A) Event free survival of copy number subtypes and whole genome doubling groups. P value represents the statistical significance of event free survival differences between the five groups. (B) TERT expression in genome undoubled and doubled tumors. Boxplot shows median and interquartile range of TERT expressions, with whiskers extending to extreme values within 1.5 interquartile ranges from the upper and lower quartiles. Each dot corresponds to a tumor. (C) Telomere length was estimated using off-target exome sequencing data corrected for tumor purity and ploidy. Top panel shows TERT expression with “x” representing missing values. TERT promoter C228T mutation (black), amplification (red) and TERF2 amplification (red) are noted in the second panel. The bottom panel represents ATRX and DAXX mutations in light blue and dark red, respectively. See also Figure S3.
Figure 4
Figure 4. Cluster of clusters
(A) Cluster of clusters (CoCs) from four platforms (DNA copy number, black; mRNA expression, red; DNA methylation, blue; miRNA expression, purple) divided the cohort into 3 groups. Presence or absence of membership for each sample is represented by black or light blue ticks, respectively. Sample parameters are aligned on top of the heatmap. White tick indicates data not available. (B) Event free survival of the 3 CoC groups. Pairwise log-rank test p values are shown. See also Figure S4 and Table S2.
Figure 5
Figure 5. Genomic landscape of ACC
(A) The ensemble of mutations, copy number alterations, methylations, subtypes and clinicopathological parameters. (B) Aggregated alterations of the p53/Rb pathway and the Wnt pathways. Activating and deactivating alterations are indicated in red and blue, respectively. (C) Mutations in epigenetic regulatory genes. See also Figure S5 and Table S3.
Figure 6
Figure 6. Pan-cancer mutational signature analysis
(A) Distribution of the mutational signatures extracted from pan-cancer analysis in the ACC cohort. Signature 2 is enriched in the cluster of clusters groups 1 and 2. (B) Circular plot of the mutational signatures in ACC and approximately 2,900 tumor samples from other cancer types. The distance to the center represents coding mutation density. Three small illustrations highlight ACC, lung squamous cell carcinoma and colorectal cancer to demonstrate their similarities in the featured directions. See also Figure S6.
Figure 7
Figure 7. Distribution of Adrenal Differentiation Score (ADS)
The 25-gene signature is shown in the expression heatmap. Adrenal cortex differentiation markers are listed on the left. Two sarcomatoid cases are indicated in red. See also Figure S7 and Table S4.

Comment in

References

    1. Alexandrov LB, Nik-Zainal S, Wedge DC, Aparicio SA, Behjati S, Biankin AV, Bignell GR, Bolli N, Borg A, Borresen-Dale AL, et al. Signatures of mutational processes in human cancer. Nature. 2013;500:415–421. - PMC - PubMed
    1. Anselmo J, Medeiros S, Carneiro V, Greene E, Levy I, Nesterova M, Lyssikatos C, Horvath A, Carney JA, Stratakis CA. A large family with Carney complex caused by the S147G PRKAR1A mutation shows a unique spectrum of disease including adrenocortical cancer. J Clin Endocrinol Metab. 2012;97:351–359. - PMC - PubMed
    1. Assie G, Letouze E, Fassnacht M, Jouinot A, Luscap W, Barreau O, Omeiri H, Rodriguez S, Perlemoine K, Rene-Corail F, et al. Integrated genomic characterization of adrenocortical carcinoma. Nat Genet. 2014;46:607–612. - PubMed
    1. Bertherat J, Groussin L, Sandrini F, Matyakhina L, Bei T, Stergiopoulos S, Papageorgiou T, Bourdeau I, Kirschner LS, Vincent-Dejean C, et al. Molecular and functional analysis of PRKAR1A and its locus (17q22–24) in sporadic adrenocortical tumors: 17q losses, somatic mutations, and protein kinase A expression and activity. Cancer Res. 2003;63:5308–5319. - PubMed
    1. Beuschlein F, Fassnacht M, Assie G, Calebiro D, Stratakis CA, Osswald A, Ronchi CL, Wieland T, Sbiera S, Faucz FR, et al. Constitutive activation of PKA catalytic subunit in adrenal Cushing’s syndrome. N Engl J Med. 2014;370:1019–1028. - PMC - PubMed

Publication types

MeSH terms