. 2016 May 9;29(5):737-750.
doi: 10.1016/j.ccell.2016.03.025.

Integrated Genomics for Pinpointing Survival Loci within Arm-Level Somatic Copy Number Alterations

Affiliations

Integrated Genomics for Pinpointing Survival Loci within Arm-Level Somatic Copy Number Alterations

David M Roy et al. Cancer Cell. .

Abstract

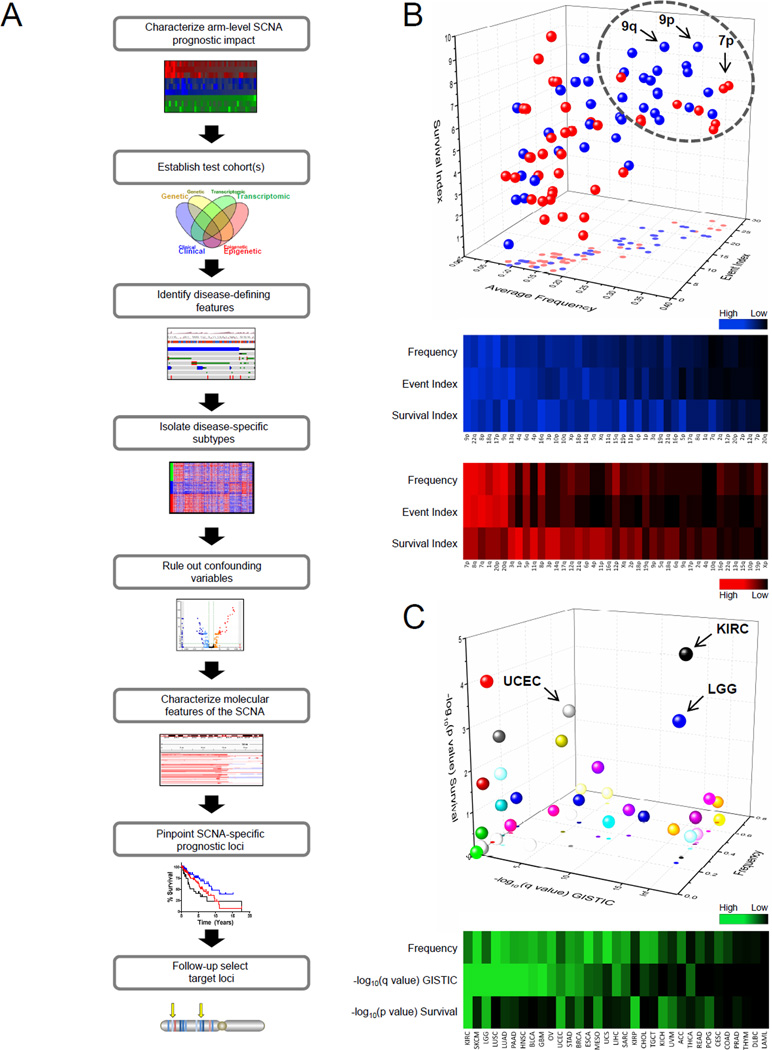
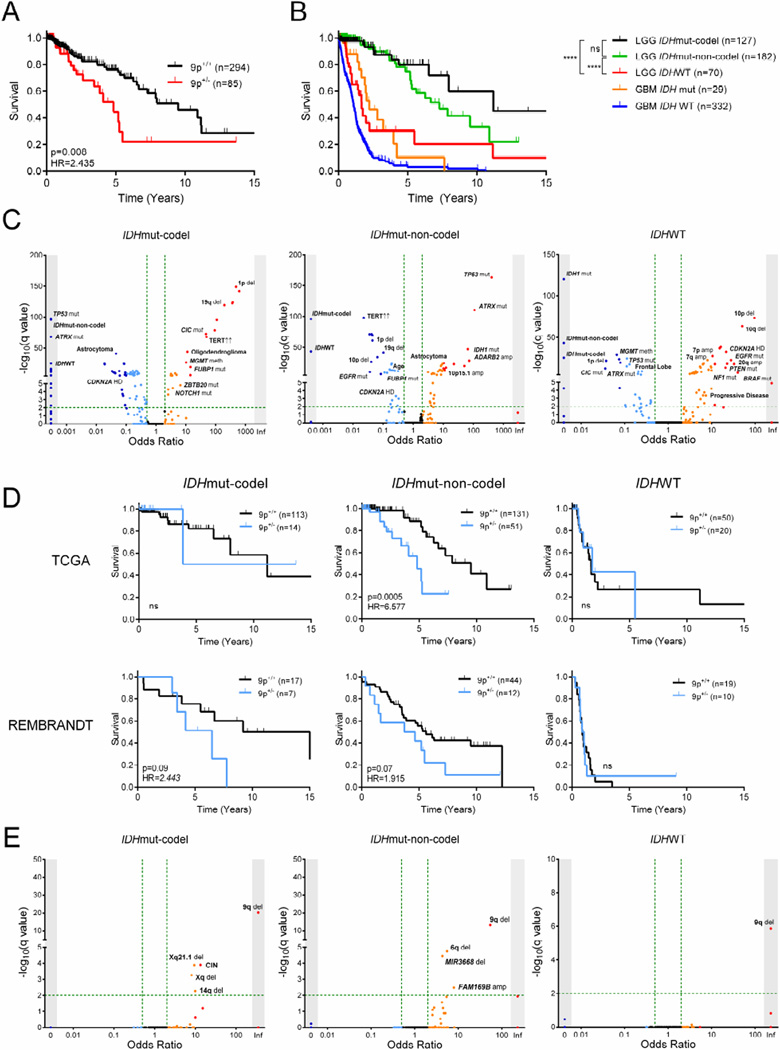
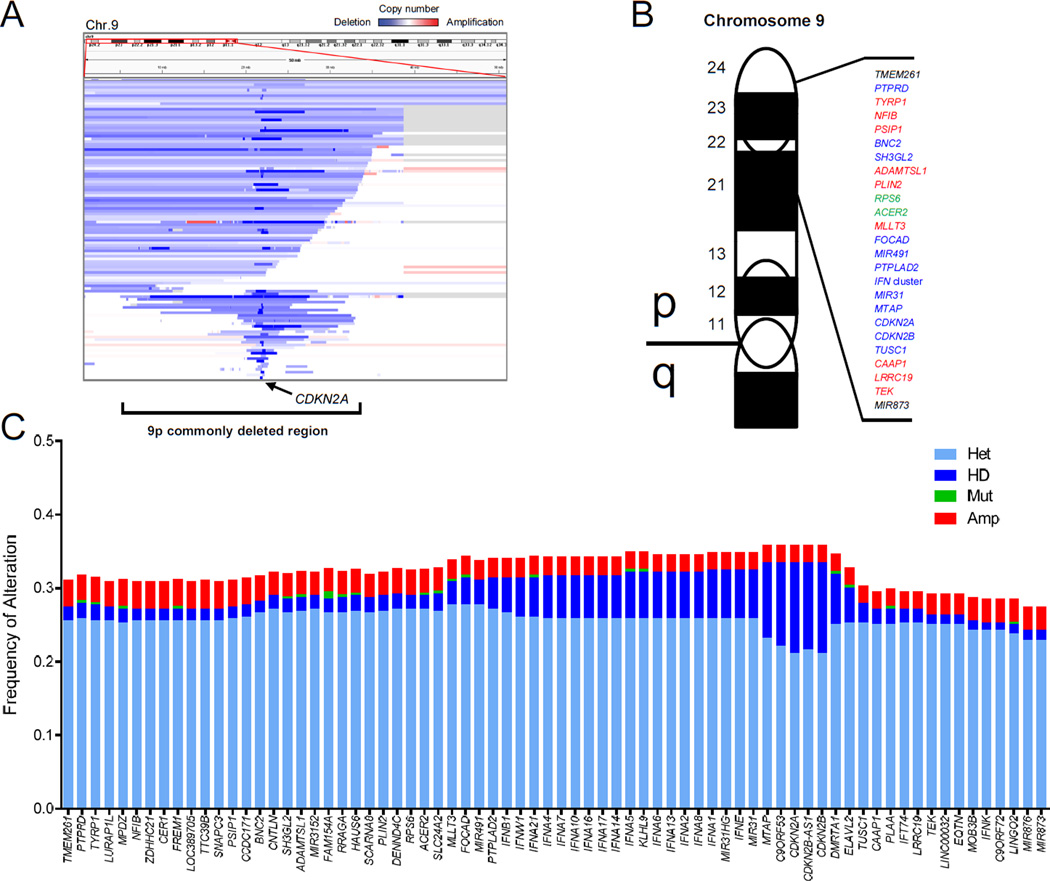
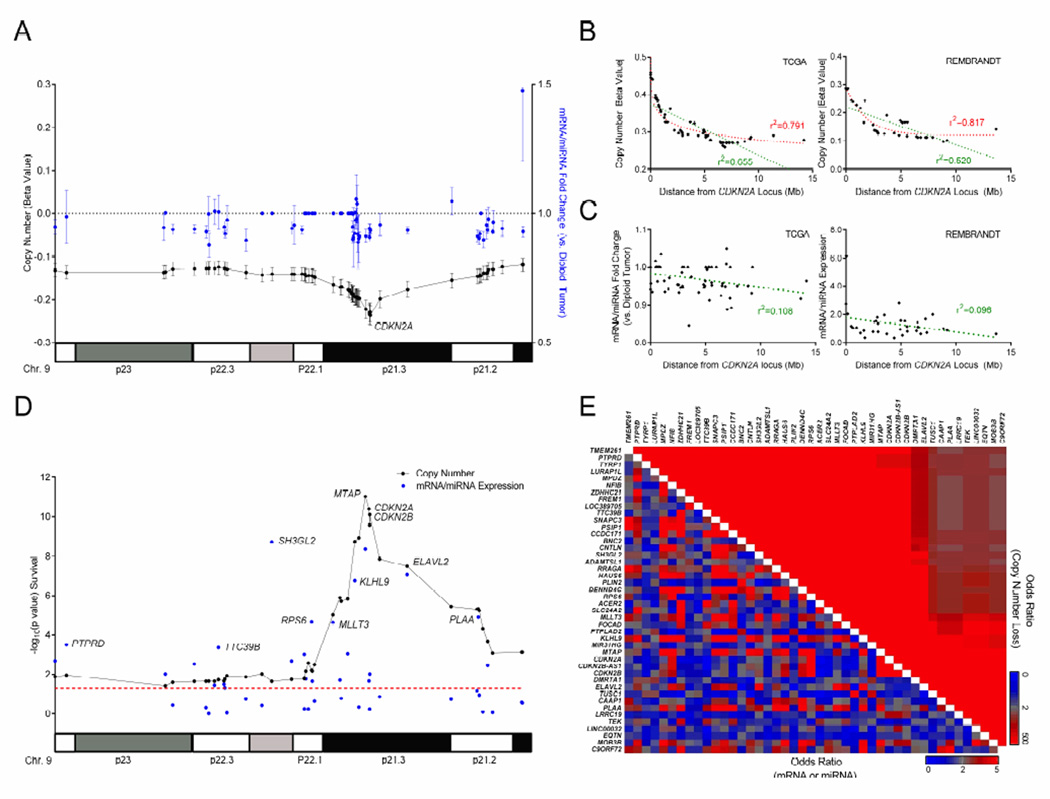
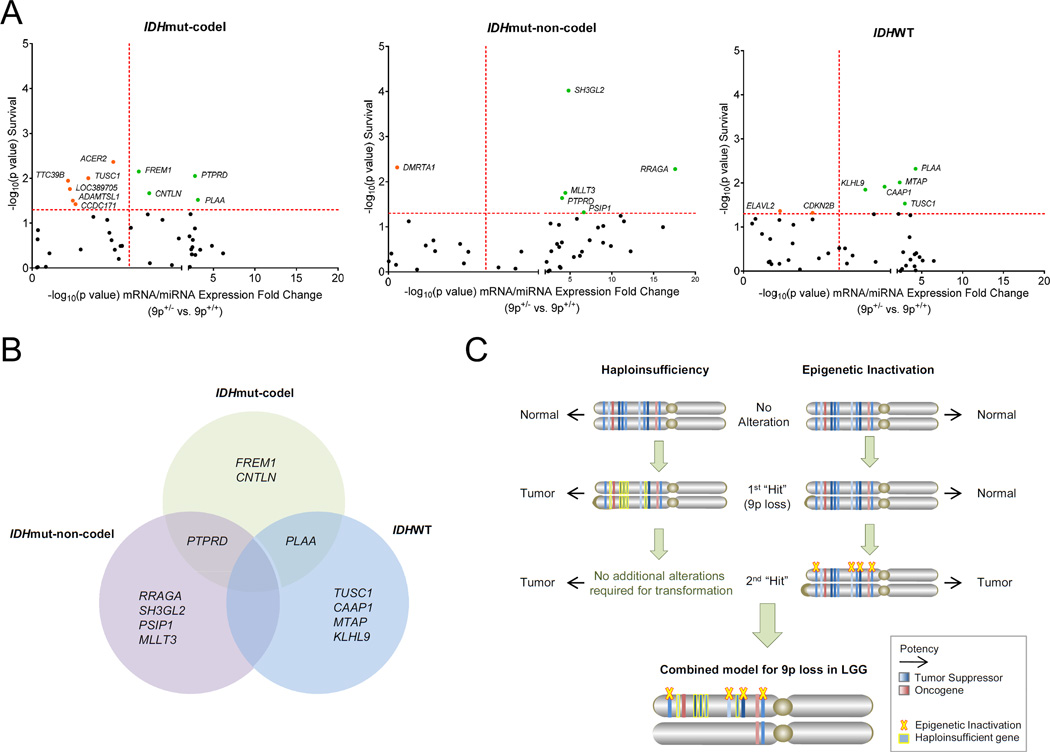
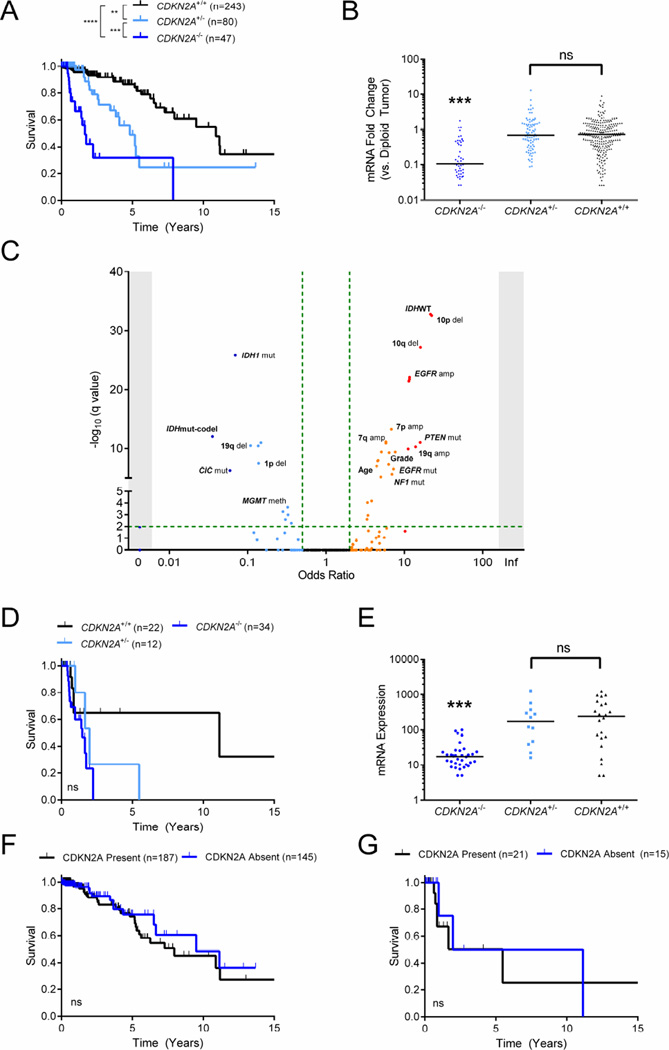
The identification of driver loci underlying arm-level somatic copy number alterations (SCNAs) in cancer has remained challenging and incomplete. Here, we assess the relative impact and present a detailed landscape of arm-level SCNAs in 10,985 patient samples across 33 cancer types from The Cancer Genome Atlas (TCGA). Furthermore, using chromosome 9p loss in lower grade glioma (LGG) as a model, we employ a unique multi-tiered genomic dissection strategy using 540 patients from three independent LGG datasets to identify genetic loci that govern tumor aggressiveness and poor survival. This comprehensive approach uncovered several 9p loss-specific prognostic markers, validated existing ones, and redefined the impact of CDKN2A loss in LGG.


Figures

Figure 1
Figure 1. Prognostic impact of arm-level SCNAs in cancer
(A) Schematic depicting arm-level SCNA dissection workflow to determine underlying driver loci. (B) Three-dimensional (3D; top) and two-dimensional (2D; bottom) representation of individual arm-level SCNA across cancer as assessed by 3 parameters: average frequency, event index (total cancer types with GISTIC q<0.25), survival index (total cancer types with OS log-rank p<0.1). Blue, deletion; Red, amplification. (C) 3D (top) and 2D (bottom) representation of frequency, GISTIC significance −log10(q value), and log-rank survival significance −log10(p value) for the 9p deletion event by cancer type. SCNA, somatic copy number alteration; OS, overall survival; LGG, lower grade glioma; KIRC, kidney renal clear cell carcinoma; UCEC, uterine corpus endometrial carcinoma; Inf, infinite. High/Low scale corresponds to values within the 3 parameters individually. See also Figure S1 and Table S1.
Figure 2
Figure 2. Characterization of LGG test cohorts
(A) Kaplan-Meier curve showing survival outcome for 9p loss in the TCGA LGG cohort. (B) Kaplan-Meier curve showing survival outcome in TCGA LGG and GBM cohorts by subtype and IDH status, respectively. ****, p<0.0001; ns, not significant. (C) Clinical and molecular variables in LGG and their association to LGG subtype. Fisher’s exact test −log10(q value) (y-axis) and odds ratio (x-axis) for association are shown. Arrows indicate increased mRNA expression. (D) Kaplan-Meier curves showing survival outcome for 9p loss in both TCGA and REMBRANDT LGG cohorts by subtype. (E) Clinical parameters and molecular events associated with 9p loss in the TCGA LGG cohort by subtype. Fisher’s exact test −log10(q value) (y-axis) and odds ratio (x-axis) for association are shown. Mut, mutant; codel, 1p/19q codeletion; LGG, lower grade glioma; WT, wild-type; GBM, glioblastoma multiforme; HR, hazard ratio; del, deletion; amp, amplification; CIN, chromosomal instability; meth, promoter hypermethylation; HD, homozygous deletion. See also Figure S2 and Tables S2 and S3.
Figure 3
Figure 3. Anatomy of the commonly deleted region on 9p in LGG
(A) Segmentation map of somatic copy number alterations (SCNAs) on chromosome 9p in the TCGA LGG cohort. (B) Diagram of select genes within the commonly deleted region on 9p ordered by chromosomal location. Known oncogenes (red), tumor suppressor genes (blue), and mixed role genes (green) are shown, along with uncharacterized loci (black). (C) Overview of genetic alterations at 72 loci for which copy number data is available within the 9p commonly deleted region in the TCGA LGG cohort. LGG, lower grade glioma; Het, heterozygous deletion; HD, homozygous deletion; Mut, mutation; Amp, amplification; Chr, chromosome; LGG, lower grade glioma. See also Figure S3 and Table S4.
Figure 4
Figure 4. Copy number and gene expression associations on 9p in LGG
(A) Plot showing mean copy number signal (beta value, black) and mean mRNA/miRNA fold change vs. diploid tumor (blue) at 44 loci contained within the 9p deletion in the TCGA LGG cohort. Error bars, ± SEM. (B and C) Linear (green) and logarithmic (red) regression plots of copy number (B) or mRNA/miRNA fold change (C) vs. distance from the CDKN2A locus in the entire TCGA (left) and REMBRANDT (right) LGG cohorts. (D) Copy number (black) and mRNA/miRNA expression (blue) −log10(p value) following Cox regression test for overall survival at 44 loci within the 9p commonly deleted region in the entire TCGA LGG cohort regardless of 9p copy number status. Red line, significance threshold (p<0.05). (E) Heatmap depicting all pair-wise associations between loci in the 9p commonly deleted region by copy number loss and mRNA/miRNA status in the TCGA LGG cohort. Mb, megabase; Chr, chromosome. See also Figure S4.
Figure 5
Figure 5. Genes targeted by 9p loss and their prognostic associations
(A) Scatterplot showing −log10(p value) Cox survival and −log10(p value) expression fold change significance (9p+/− vs. 9p+/+) for loci within 9p commonly deleted region in the TCGA LGG cohort by subtype. Red dotted line, significance threshold (p<0.05); Green, 9p loss-dependent prognostic genes; Orange, 9p loss-independent prognostic genes. (B) Genes with significantly decreased expression following 9p loss and poor overall survival from (A) are shown by LGG subtype. (C) Schematic representation of the mechanisms underlying the 9p deletion phenotype in LGG. LGG, lower grade glioma; mut, mutant; codel, 1p/19q codeletion. See also Figure S5 and Table S5.
Figure 6
Figure 6. Characterization of CDKN2A as a marker of prognosis in LGG
(A and B) Kaplan-Meier curve showing survival outcomes (A) and mRNA fold change (B) in the TCGA LGG cohort based on CDKN2A deletion status. Horizontal bars in (B) depict median. (C) Scatterplot showing any clinical and molecular associations with CDKN2A homozygous deletion in the TCGA LGG cohort. Fisher’s exact test −log10(q value) (y-axis) and odds ratio (x-axis) for association are shown. (D and E) Kaplan-Meier curve showing survival outcomes (D) and mRNA fold change (E) in TCGA LGG IDHWT tumors according to the CDKN2A deletion status. Horizontal bars in (E) depict median. (F and G) Kaplan-Meier curves showing survival outcome based on CDKN2A mRNA expression status in patients without CDKN2A homozygous deletion in the entire TCGA LGG cohort (F) and in IDHWT tumors (G). LGG, lower grade glioma. amp, amplification; del, deletion; mut, mutation; meth, promoter hypermethylation; mut, mutant; codel, 1p/19q codeletion; WT, wild-type. **, p<0.01; ***, p<0.001; ****, p<0.0001; ns, not significant. See also Figure S6 and Tables S6 and S7.

References

    1. Appin CL, Brat DJ. Molecular genetics of gliomas. Cancer journal. 2014;20:66–72. - PubMed
    1. Baudis M. Genomic imbalances in 5918 malignant epithelial tumors: an explorative meta-analysis of chromosomal CGH data. BMC cancer. 2007;7:226. - PMC - PubMed
    1. Beatty BG, Qi S, Pienkowska M, Herbrick JA, Scheidl T, Zhang ZM, Kola I, Scherer SW, Seth A. Chromosomal localization of phospholipase A2 activating protein, an Ets2 target gene, to 9p21. Genomics. 1999;62:529–532. - PubMed
    1. Belinsky SA, Nikula KJ, Palmisano WA, Michels R, Saccomanno G, Gabrielson E, Baylin SB, Herman JG. Aberrant methylation of p16(INK4a) is an early event in lung cancer and a potential biomarker for early diagnosis. Proceedings of the National Academy of Sciences of the United States of America. 1998;95:11891–11896. - PMC - PubMed
    1. Bello MJ, de Campos JM, Vaquero J, Kusak ME, Sarasa JL, Pestana A, Rey JA. Molecular and cytogenetic analysis of chromosome 9 deletions in 75 malignant gliomas. Genes, chromosomes & cancer. 1994;9:33–41. - PubMed

Publication types

MeSH terms

Substances