

A method for detecting recent changes in contemporary effective population size from linkage disequilibrium at linked and unlinked loci
- PMID: 27165767
- PMCID: PMC5026753
- DOI: 10.1038/hdy.2016.30
A method for detecting recent changes in contemporary effective population size from linkage disequilibrium at linked and unlinked loci
Abstract
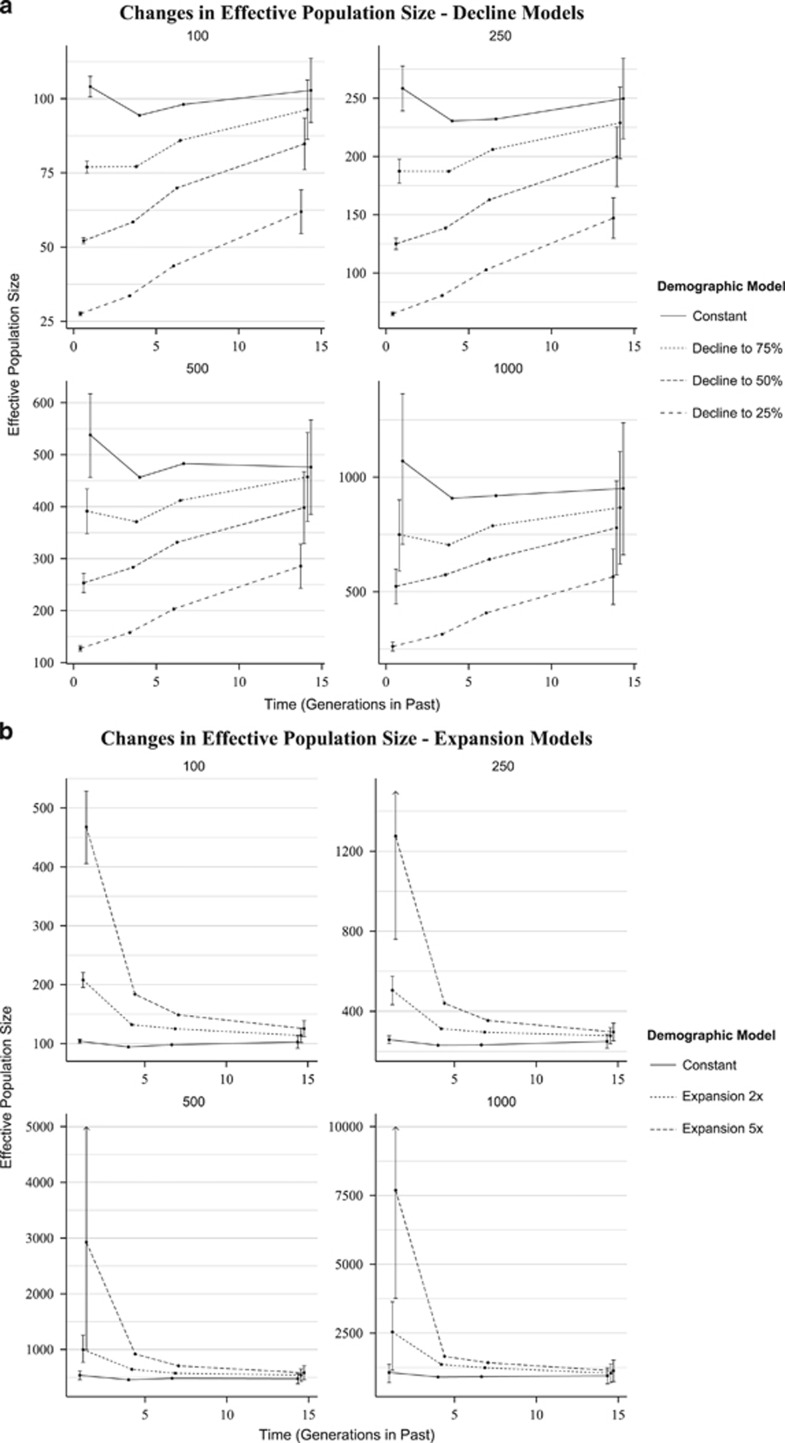
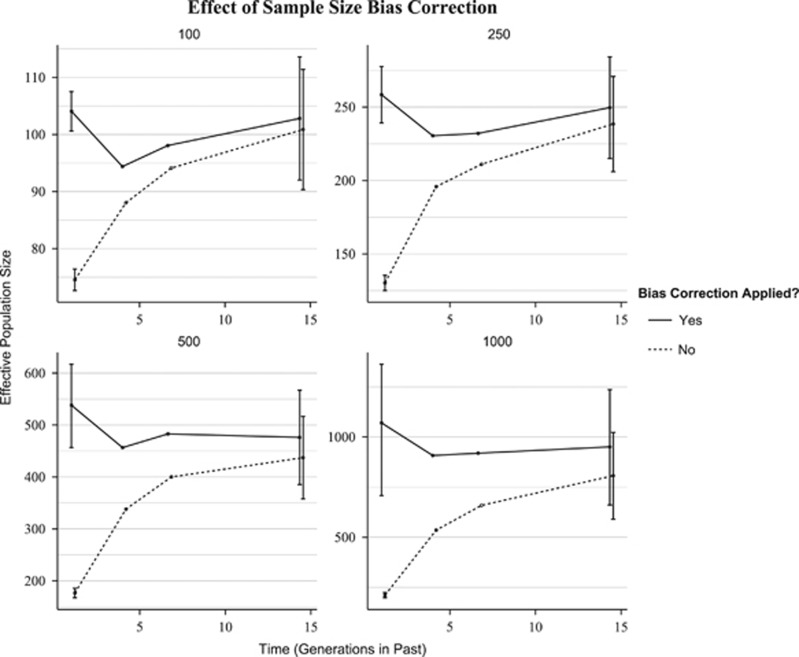
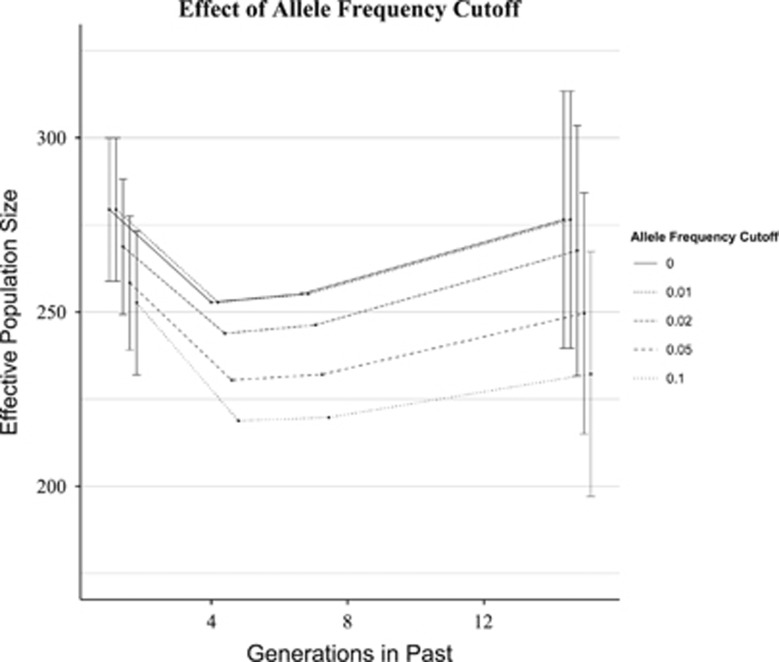
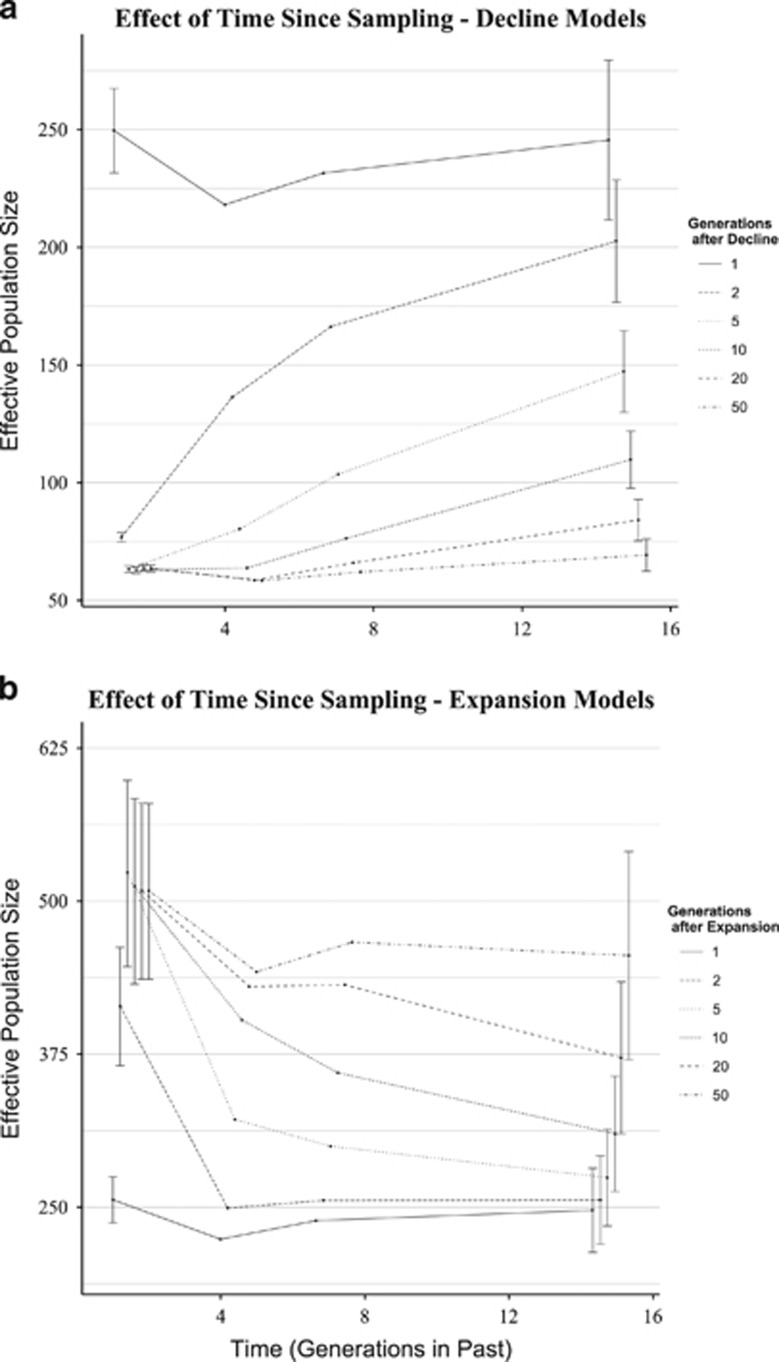
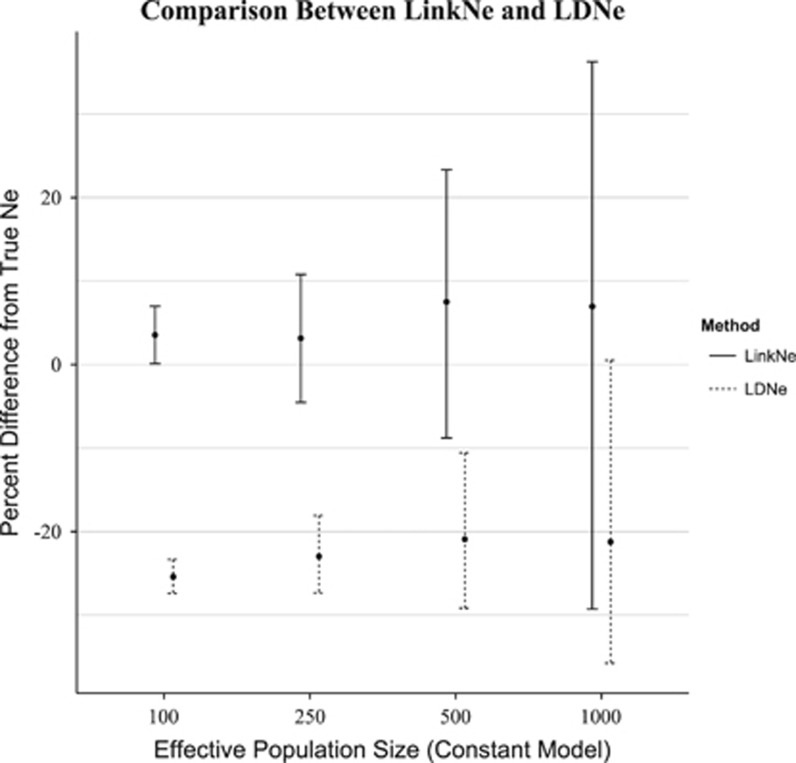
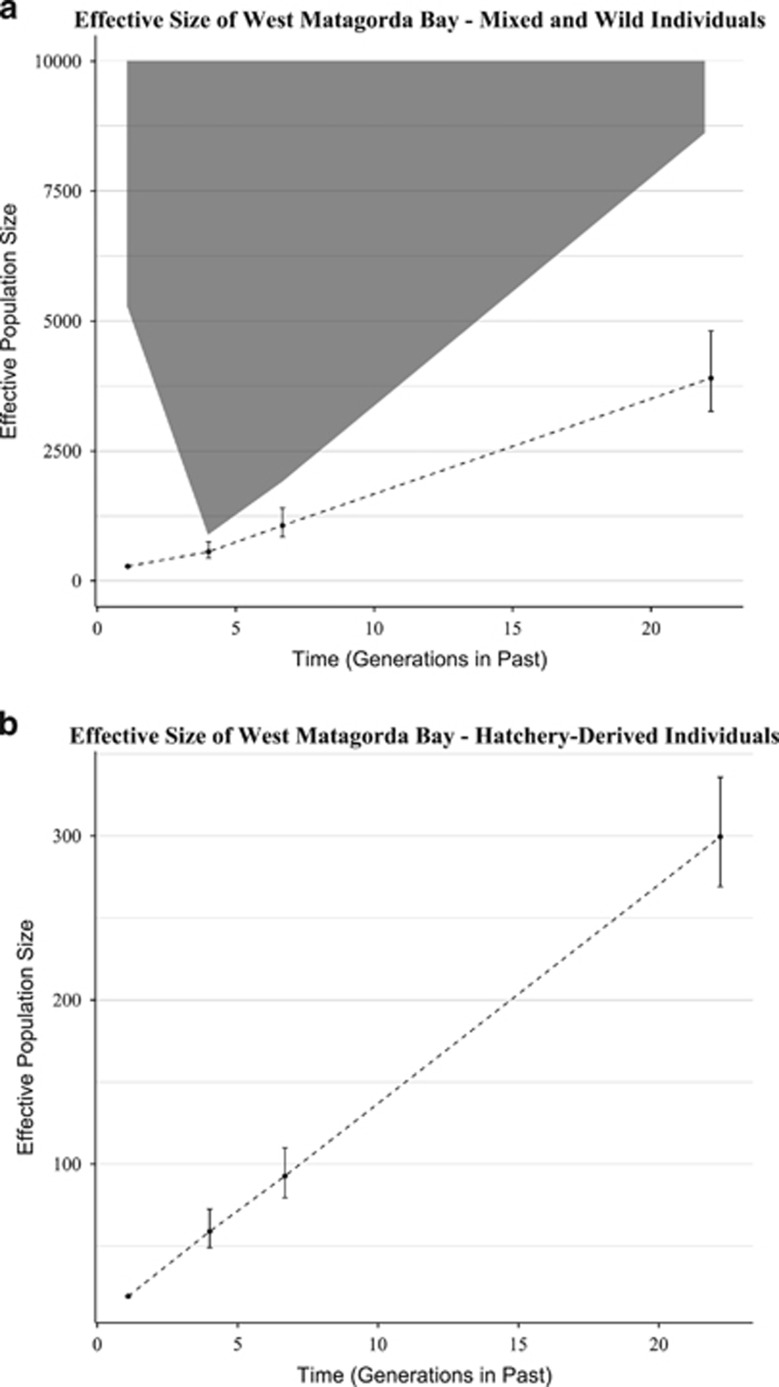
Estimation of contemporary effective population size (Ne) from linkage disequilibrium (LD) between unlinked pairs of genetic markers has become an important tool in the field of population and conservation genetics. If data pertaining to physical linkage or genomic position are available for genetic markers, estimates of recombination rate between loci can be combined with LD data to estimate contemporary Ne at various times in the past. We extend the well-known, LD-based method of estimating contemporary Ne to include linkage information and show via simulation that even relatively small, recent changes in Ne can be detected reliably with a modest number of single-nucleotide polymorphism (SNP) loci. We explore several issues important to interpretation of the results and quantify the bias in estimates of contemporary Ne associated with the assumption that all loci in a large SNP data set are unlinked. The approach is applied to an empirical data set of SNP genotypes from a population of a marine fish where a recent, temporary decline in Ne is known to have occurred.
Figures
Similar articles
-
Estimating contemporary effective population size in non-model species using linkage disequilibrium across thousands of loci.Heredity (Edinb). 2016 Oct;117(4):233-40. doi: 10.1038/hdy.2016.60. Epub 2016 Aug 24. Heredity (Edinb). 2016. PMID: 27553452 Free PMC article.
-
Estimating effective population size from linkage disequilibrium between unlinked loci: theory and application to fruit fly outbreak populations.PLoS One. 2013 Jul 23;8(7):e69078. doi: 10.1371/journal.pone.0069078. Print 2013. PLoS One. 2013. PMID: 23894410 Free PMC article.
-
Genomic inference of contemporary effective population size in a large island population of collared flycatchers (Ficedula albicollis).Mol Ecol. 2021 Aug;30(16):3965-3973. doi: 10.1111/mec.16025. Epub 2021 Jul 1. Mol Ecol. 2021. PMID: 34145933
-
Practical application of the linkage disequilibrium method for estimating contemporary effective population size: A review.Mol Ecol Resour. 2024 Jan;24(1):e13879. doi: 10.1111/1755-0998.13879. Epub 2023 Oct 24. Mol Ecol Resour. 2024. PMID: 37873672 Review.
-
Prediction and estimation of effective population size.Heredity (Edinb). 2016 Oct;117(4):193-206. doi: 10.1038/hdy.2016.43. Epub 2016 Jun 29. Heredity (Edinb). 2016. PMID: 27353047 Free PMC article. Review.
Cited by
-
Population Genomics of American Mink Using Whole Genome Sequencing Data.Genes (Basel). 2021 Feb 11;12(2):258. doi: 10.3390/genes12020258. Genes (Basel). 2021. PMID: 33670138 Free PMC article.
-
Life-history traits and effective population size in species with overlapping generations revisited: the importance of adult mortality.Heredity (Edinb). 2016 Oct;117(4):241-50. doi: 10.1038/hdy.2016.29. Epub 2016 Jun 8. Heredity (Edinb). 2016. PMID: 27273324 Free PMC article.
-
Pitfalls and windfalls of detecting demographic declines using population genetics in long-lived species.Evol Appl. 2024 Jul 14;17(7):e13754. doi: 10.1111/eva.13754. eCollection 2024 Jul. Evol Appl. 2024. PMID: 39006005 Free PMC article.
-
A brief history and popularity of methods and tools used to estimate micro-evolutionary forces.Ecol Evol. 2021 Sep 16;11(20):13723-13743. doi: 10.1002/ece3.8076. eCollection 2021 Oct. Ecol Evol. 2021. PMID: 34707813 Free PMC article. Review.
-
Estimation of contemporary effective population size and population declines using RAD sequence data.Heredity (Edinb). 2018 Mar;120(3):196-207. doi: 10.1038/s41437-017-0037-y. Epub 2017 Dec 22. Heredity (Edinb). 2018. PMID: 29269932 Free PMC article.
References
-
- Allendorf FW, Hohenlohe Pa, Luikart G. (2010). Genomics and the future of conservation genetics. Nat Rev Genet 11: 697–709. - PubMed
-
- Balloux F. (2004). Heterozygote excess in small populations and the heterozygote-excess effective population size. Evolution 58: 1891–1900. - PubMed
-
- Carson EW, Bumguardner BW, Fisher M, Saillant E, Gold JR. (2014). Spatial and temporal variation in recovery of hatchery-released red drum (Sciaenops ocellatus in stock-enhancement of Texas bays and estuaries. Fish Res 151: 191–198.
Publication types
MeSH terms
Substances
LinkOut - more resources
Full Text Sources
Other Literature Sources
Research Materials
Miscellaneous
