

Dual Transcriptome Profiling of Leishmania-Infected Human Macrophages Reveals Distinct Reprogramming Signatures
- PMID: 27165796
- PMCID: PMC4959658
- DOI: 10.1128/mBio.00027-16
Dual Transcriptome Profiling of Leishmania-Infected Human Macrophages Reveals Distinct Reprogramming Signatures
Abstract
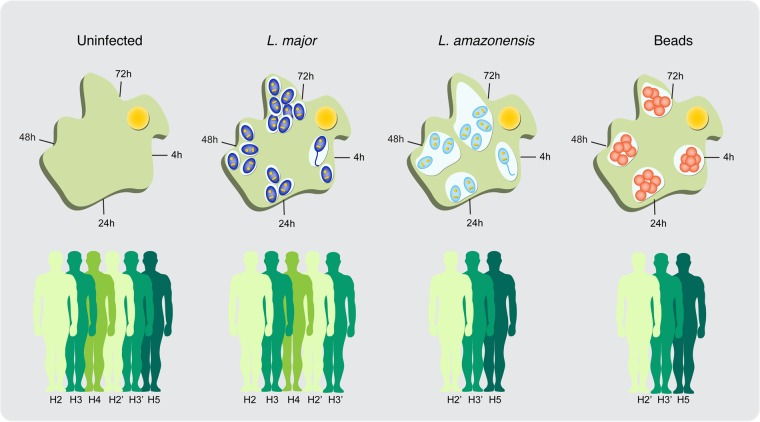
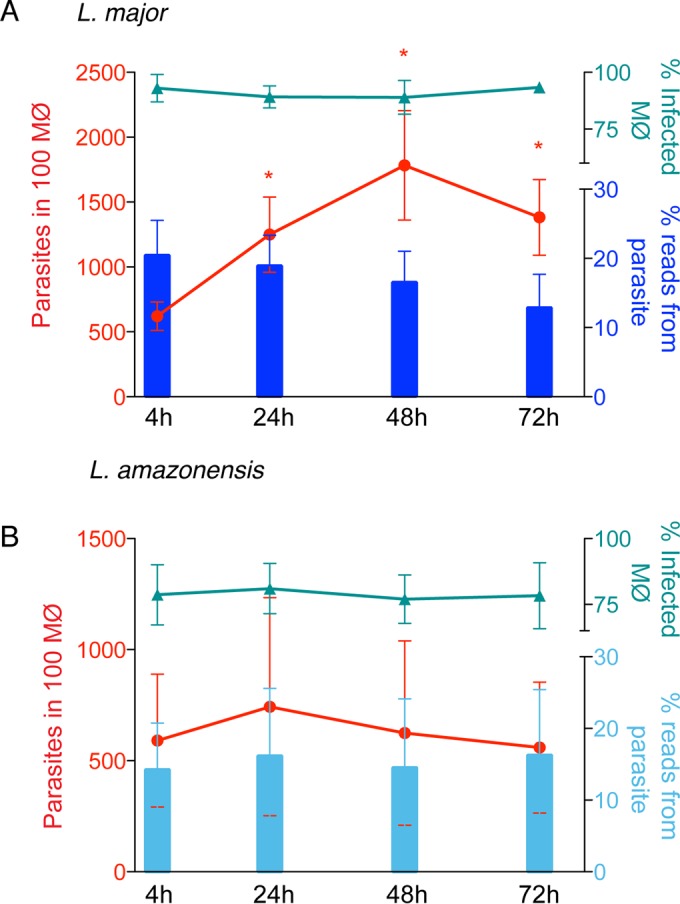
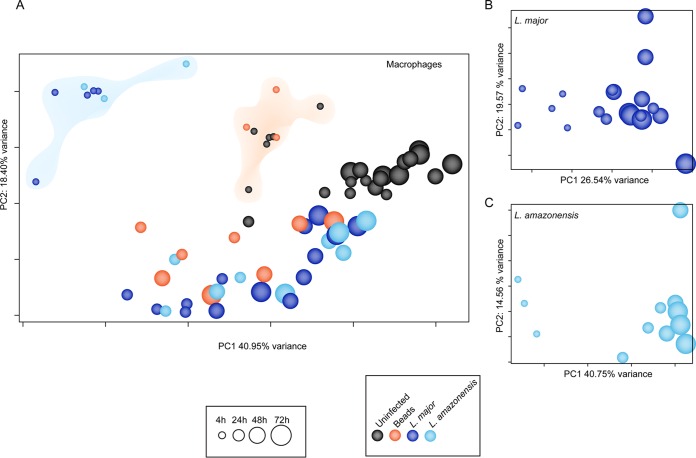
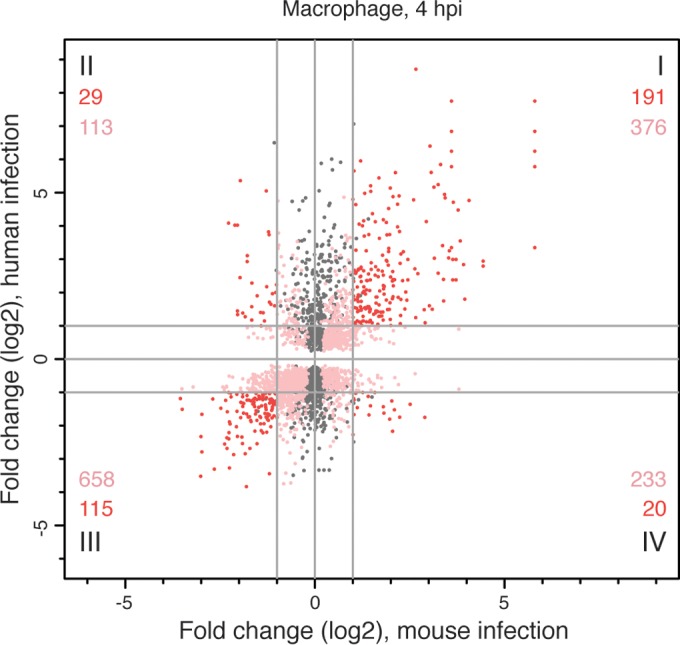
Macrophages are mononuclear phagocytes that constitute a first line of defense against pathogens. While lethal to many microbes, they are the primary host cells of Leishmania spp. parasites, the obligate intracellular pathogens that cause leishmaniasis. We conducted transcriptomic profiling of two Leishmania species and the human macrophage over the course of intracellular infection by using high-throughput RNA sequencing to characterize the global gene expression changes and reprogramming events that underlie the interactions between the pathogen and its host. A systematic exclusion of the generic effects of large-particle phagocytosis revealed a vigorous, parasite-specific response of the human macrophage early in the infection that was greatly tempered at later time points. An analogous temporal expression pattern was observed with the parasite, suggesting that much of the reprogramming that occurs as parasites transform into intracellular forms generally stabilizes shortly after entry. Following that, the parasite establishes an intracellular niche within macrophages, with minimal communication between the parasite and the host cell later during the infection. No significant difference was observed between parasite species transcriptomes or in the transcriptional response of macrophages infected with each species. Our comparative analysis of gene expression changes that occur as mouse and human macrophages are infected by Leishmania spp. points toward a general signature of the Leishmania-macrophage infectome.
Importance: Little is known about the transcriptional changes that occur within mammalian cells harboring intracellular pathogens. This study characterizes the gene expression signatures of Leishmania spp. parasites and the coordinated response of infected human macrophages as the pathogen enters and persists within them. After accounting for the generic effects of large-particle phagocytosis, we observed a parasite-specific response of the human macrophages early in infection that was reduced at later time points. A similar expression pattern was observed in the parasites. Our analyses provide specific insights into the interplay between human macrophages and Leishmania parasites and constitute an important general resource for the study of how pathogens evade host defenses and modulate the functions of the cell to survive intracellularly.
Copyright © 2016 Fernandes et al.
Figures

Similar articles
-
Simultaneous transcriptional profiling of Leishmania major and its murine macrophage host cell reveals insights into host-pathogen interactions.BMC Genomics. 2015 Dec 29;16:1108. doi: 10.1186/s12864-015-2237-2. BMC Genomics. 2015. PMID: 26715493 Free PMC article.
-
Simultaneous gene expression profiling in human macrophages infected with Leishmania major parasites using SAGE.BMC Genomics. 2008 May 21;9:238. doi: 10.1186/1471-2164-9-238. BMC Genomics. 2008. PMID: 18495030 Free PMC article.
-
Differential immune response modulation in early Leishmania amazonensis infection of BALB/c and C57BL/6 macrophages based on transcriptome profiles.Sci Rep. 2019 Dec 27;9(1):19841. doi: 10.1038/s41598-019-56305-1. Sci Rep. 2019. PMID: 31882833 Free PMC article.
-
Cell biology of host-parasite membrane interactions in leishmaniasis.Ciba Found Symp. 1983;99:113-37. doi: 10.1002/9780470720806.ch7. Ciba Found Symp. 1983. PMID: 6357669 Review.
-
In Search of Biomarkers for Pathogenesis and Control of Leishmaniasis by Global Analyses of Leishmania-Infected Macrophages.Front Cell Infect Microbiol. 2018 Sep 19;8:326. doi: 10.3389/fcimb.2018.00326. eCollection 2018. Front Cell Infect Microbiol. 2018. PMID: 30283744 Free PMC article. Review.
Cited by
-
Genomics and functional genomics in Leishmania and Trypanosoma cruzi: statuses, challenges and perspectives.Mem Inst Oswaldo Cruz. 2021 Mar 29;116:e200634. doi: 10.1590/0074-02760200634. eCollection 2021. Mem Inst Oswaldo Cruz. 2021. PMID: 33787768 Free PMC article. Review.
-
Phylloseptin-1 is Leishmanicidal for Amastigotes of Leishmaniaamazonensis Inside Infected Macrophages.Int J Environ Res Public Health. 2020 Jul 6;17(13):4856. doi: 10.3390/ijerph17134856. Int J Environ Res Public Health. 2020. PMID: 32640562 Free PMC article.
-
Leishmania infantum infection modulates messenger RNA, microRNA and long non-coding RNA expression in human neutrophils in vitro.PLoS Negl Trop Dis. 2024 Jul 19;18(7):e0012318. doi: 10.1371/journal.pntd.0012318. eCollection 2024 Jul. PLoS Negl Trop Dis. 2024. PMID: 39028711 Free PMC article.
-
Network-Based Approaches Reveal Potential Therapeutic Targets for Host-Directed Antileishmanial Therapy Driving Drug Repurposing.Microbiol Spectr. 2021 Oct 31;9(2):e0101821. doi: 10.1128/Spectrum.01018-21. Epub 2021 Oct 20. Microbiol Spectr. 2021. PMID: 34668739 Free PMC article.
-
Host and parasite responses in human diffuse cutaneous leishmaniasis caused by L. amazonensis.PLoS Negl Trop Dis. 2019 Mar 7;13(3):e0007152. doi: 10.1371/journal.pntd.0007152. eCollection 2019 Mar. PLoS Negl Trop Dis. 2019. PMID: 30845223 Free PMC article.
References
Publication types
MeSH terms
Grants and funding
LinkOut - more resources
Full Text Sources
Other Literature Sources
Molecular Biology Databases
Miscellaneous
