

Dynamic Cerebrovascular and Intracranial Pressure Reactivity Assessment of Impaired Cerebrovascular Autoregulation in Intracranial Hypertension
- PMID: 27165917
- PMCID: PMC4962914
- DOI: 10.1007/978-3-319-22533-3_51
Dynamic Cerebrovascular and Intracranial Pressure Reactivity Assessment of Impaired Cerebrovascular Autoregulation in Intracranial Hypertension
Abstract
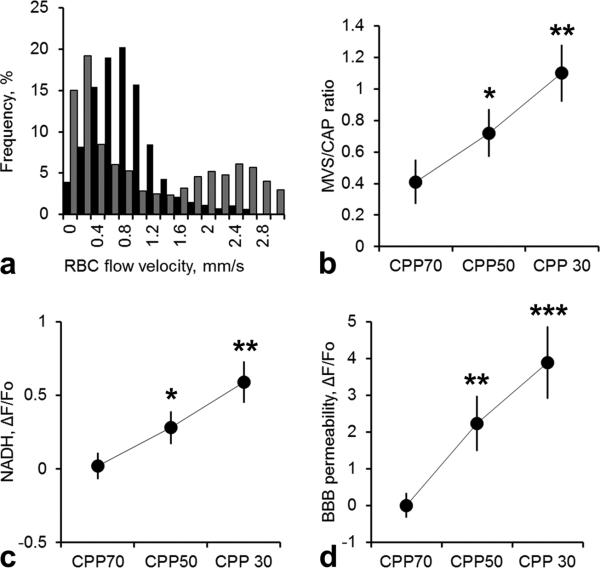
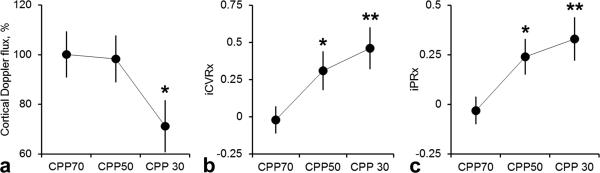
We previously suggested that the discrepancy between a critical cerebral perfusion pressure (CPP) of 30 mmHg, obtained by increasing intracranial pressure (ICP), and 60 mmHg, obtained by decreasing arterial pressure, was due to pathological microvascular shunting at high ICP [1], and that the determination of the critical CPP by the static cerebral blood flow (CBF) autoregulation curve is not valid with intracranial hypertension. Here, we demonstrated that induced dynamic ICP reactivity (iPRx), and cerebrovascular reactivity (CVRx) tests accurately identify the critical CPP in the hypertensive rat brain, which differs from that obtained by the static autoregulation curve. Step changes in CPP from 70 to 50 and 30 mmHg were made by increasing ICP using an artificial cerebrospinal fluid reservoir connected to the cisterna magna. At each CPP, a transient 10-mmHg increase in arterial pressure was induced by bolus intravenous dopamine. iPRx and iCVRx were calculated as ΔICP/Δ mean arterial pressure (MAP) and as ΔCBF/ΔMAP, respectively. The critical CPP at high ICP, obtained by iPRx and iCVRx, is 50 mmHg, where compromised capillary flow, transition of blood flow to nonnutritive microvascular shunts, tissue hypoxia, and brain-blood barrier leakage begin to occur, which is higher than the 30 mmHg determined by static autoregulation.
Keywords: Blood–brain barrier; CBF autoregulation; Cerebral blood flow; Cerebral perfusion pressure; Induced cerebrovascular reactivity; Induced intracranial pressure reactivity; Intracranial pressure; Microvascular shunt; NADH; Rats.
Figures
Similar articles
-
Induced Dynamic Intracranial Pressure and Cerebrovascular Reactivity Assessment of Cerebrovascular Autoregulation After Traumatic Brain Injury with High Intracranial Pressure in Rats.Acta Neurochir Suppl. 2018;126:309-312. doi: 10.1007/978-3-319-65798-1_60. Acta Neurochir Suppl. 2018. PMID: 29492580 Free PMC article.
-
Critical cerebral perfusion pressure at high intracranial pressure measured by induced cerebrovascular and intracranial pressure reactivity.Crit Care Med. 2014 Dec;42(12):2582-90. doi: 10.1097/CCM.0000000000000655. Crit Care Med. 2014. PMID: 25289933 Free PMC article.
-
Evaluating the Status of the Injured Brain: Cerebrovascular Reserve (CVR) Is Not Equivalent to Induced Cerebrovascular Reactivity (iCVRx) and Induced Pressure Reactivity (iPRx) in Defining the Critical Cerebral Perfusion Pressure (CPP).Adv Exp Med Biol. 2024;1463:85-89. doi: 10.1007/978-3-031-67458-7_15. Adv Exp Med Biol. 2024. PMID: 39400805
-
Monitoring of cerebrovascular autoregulation: facts, myths, and missing links.Neurocrit Care. 2009;10(3):373-86. doi: 10.1007/s12028-008-9175-7. Epub 2009 Jan 6. Neurocrit Care. 2009. PMID: 19127448 Review.
-
Beyond intracranial pressure: monitoring cerebral perfusion and autoregulation in severe traumatic brain injury.Curr Opin Crit Care. 2023 Apr 1;29(2):85-88. doi: 10.1097/MCC.0000000000001026. Epub 2023 Feb 9. Curr Opin Crit Care. 2023. PMID: 36762674 Review.
Cited by
-
Deletion of aquaporin-4 improves capillary blood flow distribution in brain edema.Glia. 2023 Nov;71(11):2559-2572. doi: 10.1002/glia.24439. Epub 2023 Jul 13. Glia. 2023. PMID: 37439315 Free PMC article.
-
The Effects of Induction and Treatment of Intracranial Hypertension on Cerebral Autoregulation: An Experimental Study.Neurol Res Int. 2018 Jun 25;2018:7053932. doi: 10.1155/2018/7053932. eCollection 2018. Neurol Res Int. 2018. PMID: 30046492 Free PMC article.
-
Therapeutic hypothermia promotes cerebral blood flow recovery and brain homeostasis after resuscitation from cardiac arrest in a rat model.J Cereb Blood Flow Metab. 2019 Oct;39(10):1961-1973. doi: 10.1177/0271678X18773702. Epub 2018 May 9. J Cereb Blood Flow Metab. 2019. PMID: 29739265 Free PMC article.
-
Dynamics of Intracranial Pressure and Cerebrovascular Reactivity During Intrahospital Transportation of Traumatic Brain Injury Patients in Coma.Neurocrit Care. 2024 Jun;40(3):1083-1088. doi: 10.1007/s12028-023-01882-3. Epub 2023 Nov 29. Neurocrit Care. 2024. PMID: 38030876 Free PMC article.
-
Quantification of Capillary Perfusion in an Animal Model of Acute Intracranial Hypertension.J Neurotrauma. 2021 Feb 15;38(4):446-454. doi: 10.1089/neu.2019.6901. Epub 2020 Nov 6. J Neurotrauma. 2021. PMID: 32998634 Free PMC article.
References
-
- Aries MJ, Czosnyka M, Budohoski KP, Kolias AG, Radolovich DK, et al. Continuous Monitoring of Cerebrovascular Reactivity Using Pulse Waveform of Intracranial Pressure. Neurocrit Care. 2012 - PubMed
-
- Hlatky R, Valadka AB, Robertson CS. Analysis of dynamic autoregulation assessed by the cuff deflation method. Neurocrit Care. 2006;4:127–132. - PubMed
-
- Panerai RB. Assessment of cerebral pressure autoregulation in humans--a review of measurement methods. Physiol Meas. 1998;19:305–338. - PubMed
-
- Harper AM. The inter-relationship between aPco-2 and blood pressure in the regulation of blood flow through the cerebral cortex. Acta Neurol Scand Suppl. 1965;14:94–103. - PubMed
Publication types
MeSH terms
Substances
Grants and funding
LinkOut - more resources
Full Text Sources
Other Literature Sources