. 2016 Jul 26;7(30):47061-47081.
doi: 10.18632/oncotarget.9219.

Identification of a new gene regulatory circuit involving B cell receptor activated signaling using a combined analysis of experimental, clinical and global gene expression data

Affiliations

Identification of a new gene regulatory circuit involving B cell receptor activated signaling using a combined analysis of experimental, clinical and global gene expression data

Alexandra Schrader et al. Oncotarget. .

Abstract

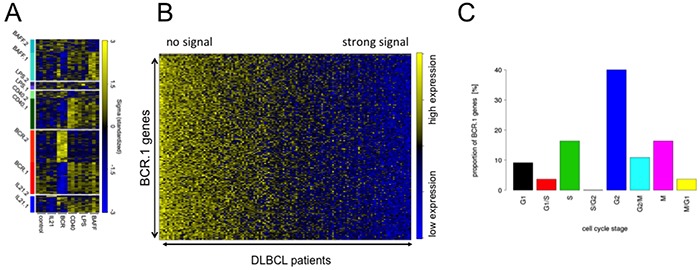
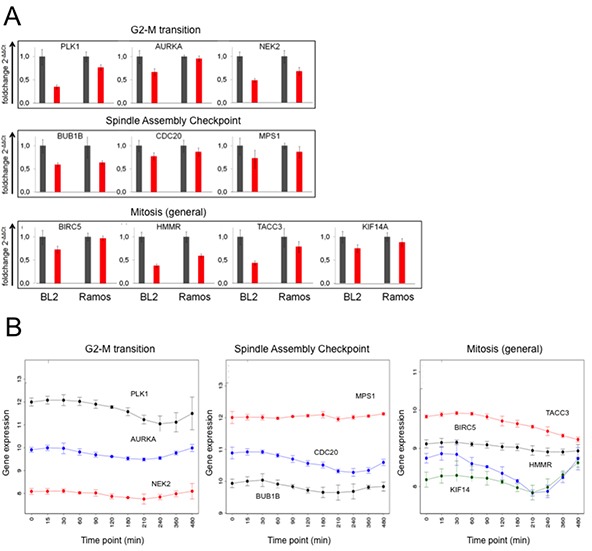
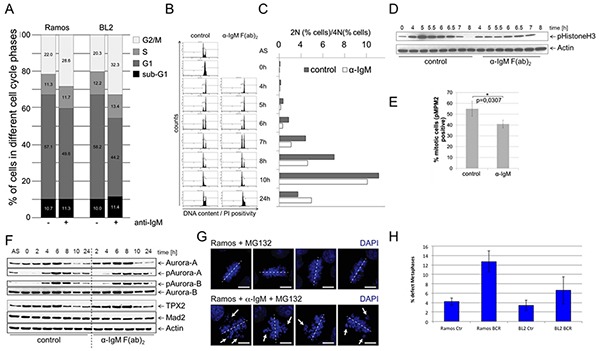
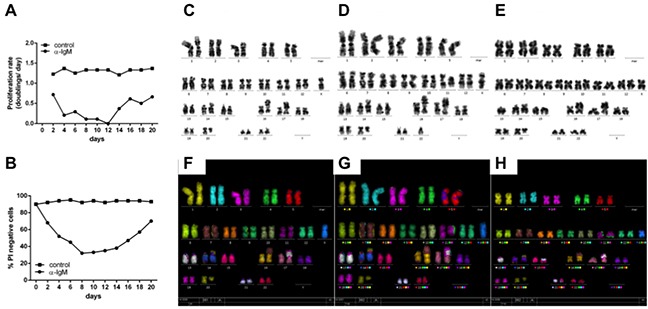
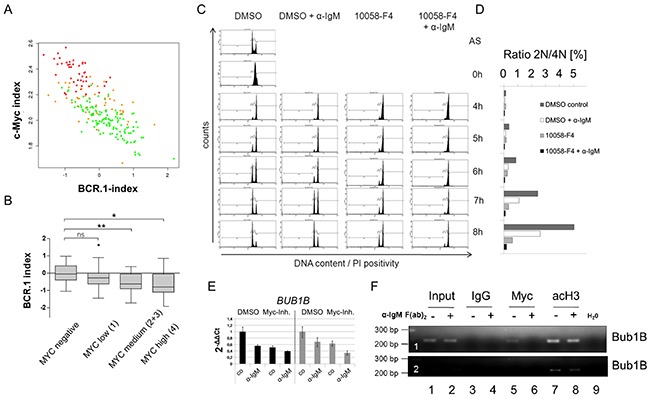
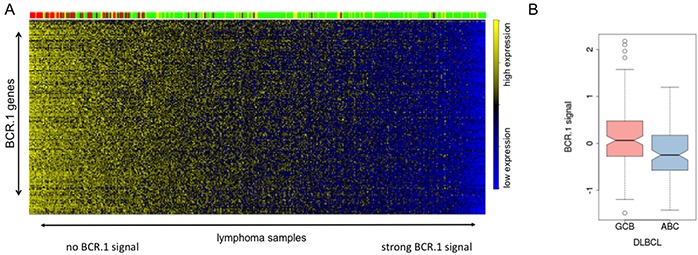
To discover new regulatory pathways in B lymphoma cells, we performed a combined analysis of experimental, clinical and global gene expression data. We identified a specific cluster of genes that was coherently expressed in primary lymphoma samples and suppressed by activation of the B cell receptor (BCR) through αIgM treatment of lymphoma cells in vitro. This gene cluster, which we called BCR.1, includes numerous cell cycle regulators. A reduced expression of BCR.1 genes after BCR activation was observed in different cell lines and also in CD10+ germinal center B cells. We found that BCR activation led to a delayed entry to and progression of mitosis and defects in metaphase. Cytogenetic changes were detected upon long-term αIgM treatment. Furthermore, an inverse correlation of BCR.1 genes with c-Myc co-regulated genes in distinct groups of lymphoma patients was observed. Finally, we showed that the BCR.1 index discriminates activated B cell-like and germinal centre B cell-like diffuse large B cell lymphoma supporting the functional relevance of this new regulatory circuit and the power of guided clustering for biomarker discovery.

Keywords: B cell receptor signaling; cell cycle delay; chromosomal aberrations; guided clustering; lymphoma.


Conflict of interest statement

The authors declare no competing financial interests.

Figures

Figure 1
Figure 1. Guided Clustering identifies gene clusters dominantly affected by one specific intervention
A. Heatmap representation of the gene expression levels for the genes within the ten transcriptional modules identified by guided clustering analysis. Global gene expression of stimulated BL2 cells and gene expression profiles from 175 lymphoma patients without Myc-translocations [28, 30]. BL2 cells treated with αIgM treatment, CD40L, LPS, BAFF and IL21. Each column in the heatmap represents a gene and each row represents a microarray sample. Yellow and blue indicate high and low gene expression. Heatmap shows the gene expression of the corresponding cluster genes in stimulated BL2 cells compared to unstimulated cells. B. A heatmap representation of BCR.1 genes in gene expression profiles of 137 primary lymphoma. The patient samples are ordered according to their increasing BCR.1 index starting with the lowest index on the very left end of the heatmap [30]. C. Gene ontology based analysis of the fraction of genes from the BCR.1 gene cluster associated with the cell cycle. GO Term analysis gives frequency of BCR.1 genes involved in different cell cycle phases (information taken from www.cyclebase.org)(for additional details see also Supplementary Table S2).
Figure 2
Figure 2. Expression of genes from the BCR.1 gene module is deliberately suppressed in lymphoma cells
A. Expression of the genes for PLK1, AURKA, NEK2, BUB1B, CDC20, MPS1, BIRC5, HMMR, TACC3 and KIF14A in response to αIgM treatment was analysed in BL2 and Ramos cells using qRT-PCR. One representative experiment out of three is shown. All samples were analysed in triplicate. Expression of the genes is shown as 2−ΔΔCT relative to abl housekeeper expression and compared to unstimulated control. B. Time dependent suppression of genes as in Figure 2A by αIgM treatment of BL2 cells. Data are taken from Human ST1.0 microarray analysis. Differentially expressed genes were identified using linear models as implemented in the Bioconductor package LIMMA [68].
Figure 3
Figure 3. BCR activation is associated with a prolongation of the G2 phase, a deceleration of M phase entrance and metaphase defects
A. Percent of BL2 and Ramos cells in different cell cycle phases with and without αIgM stimulation. Asynchronous growing BL cell line Ramos cells were stimulated by αIgM and cell cycle changes were detected using flow cytometry according to Nicoletti 6h after stimulation. B. Monitoring of the passage of synchronized Ramos cells through the cell cycle. Double thymidine block synchronized cells were released from cell cycle block and simultaneously stimulated using αIgM or left untreated. C. Percentage of cells within the different cell cycle phases as monitored by flow cytometry as in B. D. Changes in Histone 3 phosphorylation of synchronized Ramos cells after release from cell cycle block and simultaneously stimulated using αIgM or left untreated as monitored by immunoblot. E. Determination of the percentage of mitotic cells measured by phosphorylation of MPM2 (pMPM2) by flow cytometrical analyses of fixed cells 12h after stimulation. F. Thymidine synchronized Ramos cells were released from cell cycle block and treated as in B. Phosphorylation of AUROKA and AUROKB and their expression was monitored in unstimulated and αIgM stimulated cells in comparison to MAD2 and TPX2 as described recently [42]. Changes in Aurora kinase phosphorylation and TPX protein levels as measured by ImageJ quantification analysis shown within the Supplementary Figure S2. G. Detection of defective metaphases in αIgM stimulated cells quantified by microscopy. Thymidine synchronized Ramos cells were released from cell cycle block and treated as described in B. Two hours before harvesting cells were treated with 10μM MG132. Cells were stained with DAPI. H. The percentage of defect metaphases was calculated as monitored by microscopy exemplified in G.
Figure 4
Figure 4. Continiously αIgM treated B cells are characterized by additional chromosomal aberrations
A. Ramos cells were treated with αIgM or left untreated for at least 21 days adding αIgM every 24hrs after adjusting cell numbers according to untreated cells. Data are presented as proliferation rate (see additional details within the supplementary Material and Methods section). B. Cell viability of Ramos cells was measured by the number of propidium-iodide positive Ramos cells using FACS. C. Karyotype of Ramos cells in the absence of BCR activation. Karyotype of Ramos after chronic αIgM stimulation for 21 D. and 28 days E. respectively. F. M-FISH of Ramos cells in the absence of BCR activation. M-FISH of Ramos cells after chronic αIgM stimulation for 21 G. and 28 days H. respectively. Shown are additional chromosome aberrations of add(16)(q24) after 21d (D/G) and of t(15;21)(q14?;q22) after 28days (E/H) αIgM treatment respectively.
Figure 5
Figure 5. c-Myc is involved in the regulation of cell cycle regulators from the BCR.1 gene cluster
A. The BCR.1 index is inversely correlated with the c-Myc index in distinct groups of lymphoma patients and discriminates Burkitt lymphoma from diffuse large B cell lymphoma. The parallel activity was estimated plotting the BCR.1 and c-Myc indices against each other and calculating the respective correlation coefficient. The correlation coefficients of the BCR.1 index and the c-Myc index were calculated in gene expression profiles of 219 aggressive NHL [30]. The NHL cases were assigned to the following molecular categories: mBL (red), non-mBL (green) and intermediate lymphoma (yellow) based on their gene expression profiles [30]. B. The BCR.1 index is inversely correlated to the number of c-Myc positive cells in NHL. c-Myc protein levels were determined using immunohistochemical staining of tissue-microarrays. The scoring was performed as follows: low expression (0-25% positive cells) and high expression (25-100 % positive cells). C. B cell receptor activation and c-Myc-inhibition delays the G2/M cell cycle phase transition in an additive way as monitored by the passage of synchronized Ramos cells through the cell cycle. Double thymidine block synchronized Ramos cells were analysed as described in Figure 3. D. Percentage of cells within the different cell cycle phases monitored by flow cytometry as in C. E. qRT-PCR analysis of BUB1B gene expression in BL2 (black bars) or Ramos cells (grey bars). BL2 and Ramos cells were pretreated for 3h with 60μM 10058-F4 c-Myc inhibitor or solvent (DMSO). Cells were stimulated for an additional 3h with αIgM F(ab)2 fragment (12μg/ml). qRT-PCR analyses were performed using SYBR green. Fold changes were calculated using the ΔΔCt method. One representative experiment of three replicates is shown. Additional BCR.1 genes are shown in the extended view figure E1. F. c-Myc binds to the BUB1B gene. A fragment was amplified that encompasses the previously described E-box in intron 1 of the BUB1B gene [45]. ChIP was performed using antibodies directed against IgG as a negative control (lanes 3,4), against c-Myc (lanes 5,6) and against acetylated histone H3 as positive control (marker for active transcription) (lanes 7,8). c-Myc binds to the BUB1B gene (lane 5) but this binding is lost as a result of B cell receptor activation (lane 6). The lower electropherogram shows a shorter exposure time to show differences in acetyl Histone H3 binding.
Figure 6
Figure 6. The BCR.1 index characterizes individual aggressive NHL and discriminates between ABC- and GCB-like DLBCL
A. The heatmap is showing the expression of BCR.1 genes (row) in molecular profiles of 389 primary lymphoms samples (columns) from distinct patient cohorts [30, 47]. The patient samples are ordered according to rising BCR.1 index from left to right. The colour-coded bar on top of the heatmaps represents the affiliation of patients tomBL (red), non-mBL (green) and yellow (intermediate) diagnosis. B. Boxplot of the distribution of indices for BCR-repressed genes comparing 281 DLBCL samples based on their relation to GCB- and ABC-like DLBCL classification. The difference is highly significant with p=9.35e−06.

Similar articles

Cited by

References

    1. Shaffer AL, 3rd, Young RM, Staudt LM. Pathogenesis of human B cell lymphomas. Annu Rev Immunol. 2012;30:565–610. - PMC - PubMed
    1. Klein U, Dalla-Favera R. Germinal centres: role in B-cell physiology and malignancy. Nat Rev Immunol. 2008;8:22–33. - PubMed
    1. Coiffier B. State-of-the-art therapeutics: diffuse large B-cell lymphoma. J Clin Oncol. 2005;23:6387–6393. - PubMed
    1. Martelli M, Ferreri AJ, Agostinelli C, Di Rocco A, Pfreundschuh M, Pileri SA. Diffuse large B-cell lymphoma. Critical reviews in oncology/hematology. 2013;87:146–171. - PubMed
    1. Kubuschok B, Held G, Pfreundschuh M. Management of diffuse large B-cell lymphoma (DLBCL) Cancer treatment and research. 2015;165:271–288. - PubMed

MeSH terms

Substances