

Density, Distribution, and Composition of Immune Infiltrates Correlate with Survival in Merkel Cell Carcinoma
- PMID: 27166398
- PMCID: PMC5857157
- DOI: 10.1158/1078-0432.CCR-16-0392
Density, Distribution, and Composition of Immune Infiltrates Correlate with Survival in Merkel Cell Carcinoma
Abstract
Purpose: Merkel cell carcinoma (MCC) is an aggressive cancer with frequent metastasis and death with few effective therapies. Because programmed death ligand-1 (PD-L1) is frequently expressed in MCC, immune checkpoint blockade has been leveraged as treatment for metastatic disease. There is therefore a critical need to understand the relationships between MCPyV status, immune profiles, and patient outcomes.
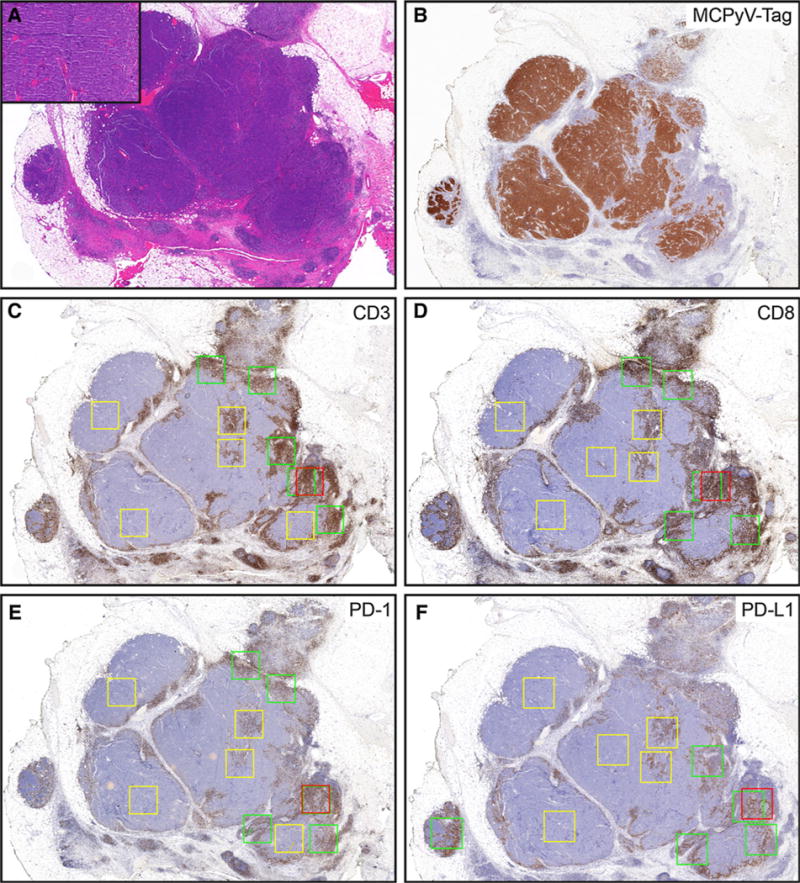
Experimental design: IHC for CD3, CD8, PD-1, PD-L1, and MCPyV T-antigen (to determine MCPyV status) was performed on 62 primary MCCs with annotated clinical outcomes. Automated image analysis quantified immune cell density (positive cells/mm2) at discrete geographic locations (tumor periphery, center, and hotspot). T-cell receptor sequencing (TCRseq) was performed in a subset of MCCs.
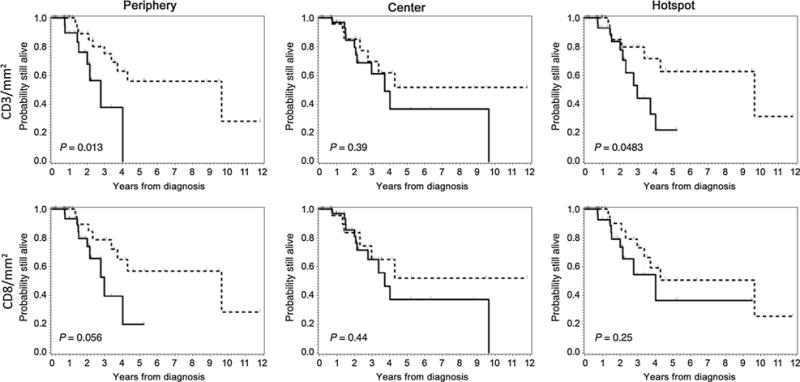
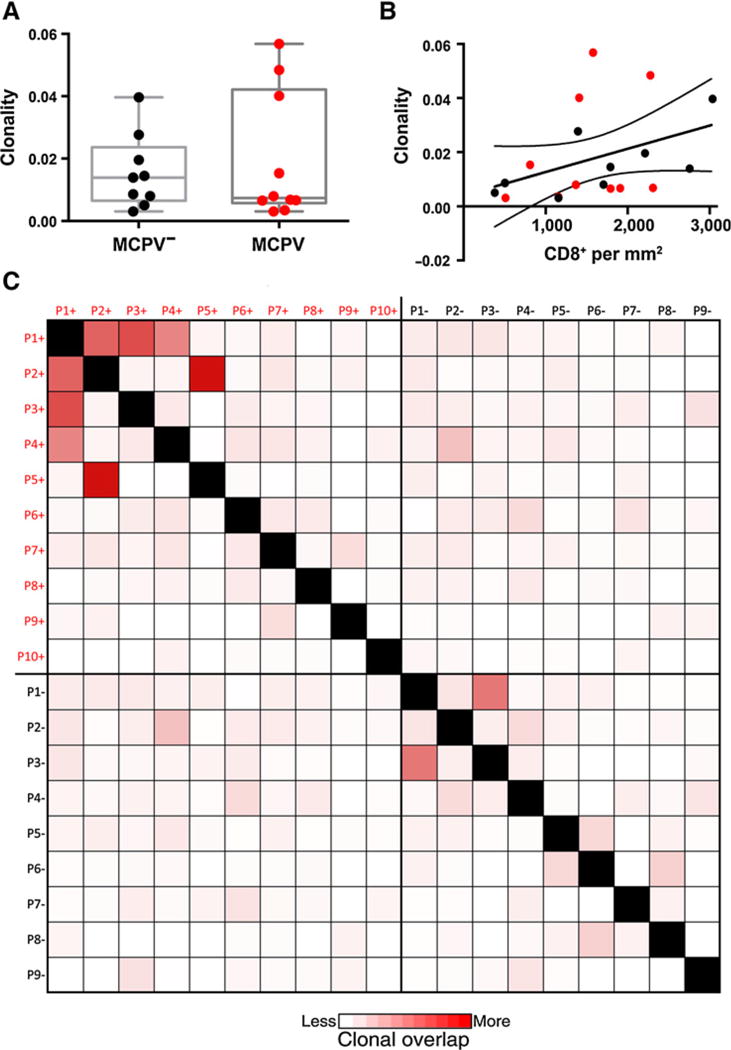
Results: No histopathologic variable associated with overall survival (OS) or disease-specific survival (DSS), whereas higher CD3+ (P = 0.004) and CD8+ (P = 0.037) T-cell density at the tumor periphery associated with improved OS. Higher CD8+ T-cell density at the tumor periphery associated with improved DSS (P = 0.049). Stratifying MCCs according to MCPyV status, higher CD3+ (P = 0.026) and CD8+ (P = 0.015) T-cell density at the tumor periphery associated with improved OS for MCPyV+ but not MCPyV- MCC. TCRseq revealed clonal overlap among MCPyV+ samples, suggesting an antigen-specific response against a unifying antigen.
Conclusions: These findings establish the tumor-associated immune infiltrate at the tumor periphery as a robust prognostic indicator in MCC and provide a mechanistic rationale to further examine whether the immune infiltrate at the tumor periphery is relevant as a biomarker for response in ongoing and future checkpoint inhibitor trials in MCC. Clin Cancer Res; 22(22); 5553-63. ©2016 AACR.
©2016 American Association for Cancer Research.
Conflict of interest statement
No potential conflicts of interest were disclosed.
Figures
References
-
- Hodgson NC. Merkel cell carcinoma: changing incidence trends. J Surg Oncol. 2005;89:1–4. - PubMed
-
- Fitzgerald TL, Dennis S, Kachare SD, Vohra NA, Wong JH, Zervos EE. Dramatic increase in the incidence and mortality from merkel cell carcinoma in the United States. Am Surg. 2015;81:802–6. - PubMed
-
- Albores-Saavedra J, Batich K, Chable-Montero F, Sagy N, Schwartz AM, Henson DE. Merkel cell carcinoma demographics, morphology, and survival based on 3870 cases: a population based study. J Cutan Pathol. 2010;37:20–7. - PubMed
-
- Andea AA, Coit DG, Amin B, Busam KJ. Merkel cell carcinoma: histologic features and prognosis. Cancer. 2008;113:2549–58. - PubMed
-
- Engels EA, Frisch M, Goedert JJ, Biggar RJ, Miller RW. Merkel cell carcinoma and HIV infection. Lancet. 2002;359:497–8. - PubMed
MeSH terms
Substances
Grants and funding
LinkOut - more resources
Full Text Sources
Other Literature Sources
Medical
Research Materials
