. 2016 May 24;113(21):E2906-15.
doi: 10.1073/pnas.1600736113. Epub 2016 May 10.

Myosin MyTH4-FERM structures highlight important principles of convergent evolution

Affiliations

Myosin MyTH4-FERM structures highlight important principles of convergent evolution

Vicente José Planelles-Herrero et al. Proc Natl Acad Sci U S A. .

Abstract

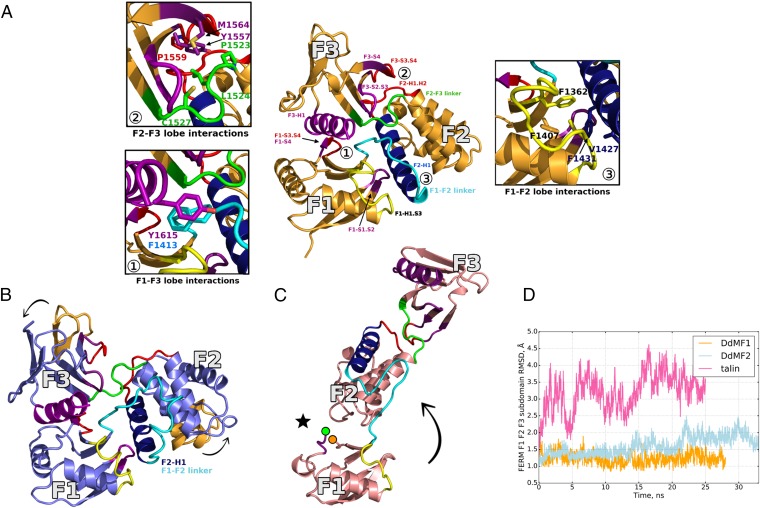
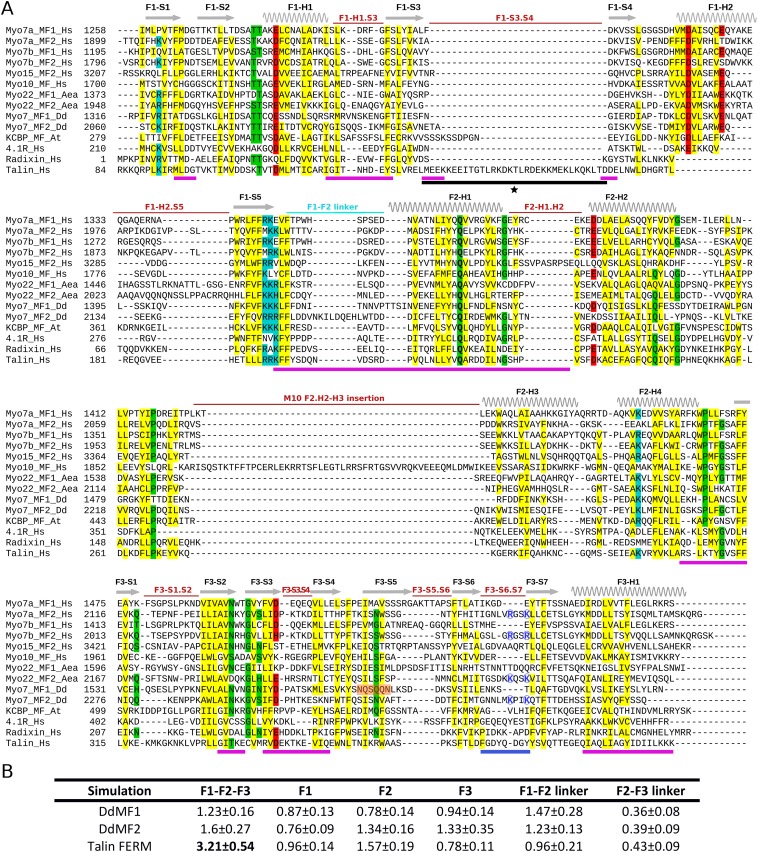
Myosins containing MyTH4-FERM (myosin tail homology 4-band 4.1, ezrin, radixin, moesin, or MF) domains in their tails are found in a wide range of phylogenetically divergent organisms, such as humans and the social amoeba Dictyostelium (Dd). Interestingly, evolutionarily distant MF myosins have similar roles in the extension of actin-filled membrane protrusions such as filopodia and bind to microtubules (MT), suggesting that the core functions of these MF myosins have been highly conserved over evolution. The structures of two DdMyo7 signature MF domains have been determined and comparison with mammalian MF structures reveals that characteristic features of MF domains are conserved. However, across millions of years of evolution conserved class-specific insertions are seen to alter the surfaces and the orientation of subdomains with respect to each other, likely resulting in new sites for binding partners. The MyTH4 domains of Myo10 and DdMyo7 bind to MT with micromolar affinity but, surprisingly, their MT binding sites are on opposite surfaces of the MyTH4 domain. The structural analysis in combination with comparison of diverse MF myosin sequences provides evidence that myosin tail domain features can be maintained without strict conservation of motifs. The results illustrate how tuning of existing features can give rise to new structures while preserving the general properties necessary for myosin tails. Thus, tinkering with the MF domain enables it to serve as a multifunctional platform for cooperative recruitment of various partners, allowing common properties such as autoinhibition of the motor and microtubule binding to arise through convergent evolution.

Keywords: filopodia; microtubules; molecular tinkering; protein evolution.


Conflict of interest statement

The authors declare no conflict of interest.

Figures

Fig. 1.
Fig. 1.
Evolutionarily distant myosins with a shared conserved MF. (A) Schematic illustration of the MF myosin family showing the tail domain organization. (B) Distribution of MF myosins through phylogeny. A schematized phylogenetic tree (Left) illustrating the relative positions of major phyla and the MF myosins found in representative species (Right) (5). ●, myosin present; ○, myosin not found in this branch of the tree. (C) Ribbon representation illustrating the X-ray structures of HsMyo10MF (27), MmMyo7aMF1 (30), DdMF1, and DdMF2. The structures are all presented with their F1 lobe in a similar orientation. Note the variation in how the F2 and F3 lobes are positioned compared with the F1 lobe in each FERM domain. The F2-H1 helix (red star) orientation is, however, similar in all structures because it participates in strong interactions that maintain the cloverleaf configuration (see also Fig. 6).
Fig. S1.
Fig. S1.
Structural comparison of DdMyo7 WT and mutant DdMF1 and DdMF2. (A, Left) Superimposition of the DdMF1 WT (orange) and mutant #2 K1157E, H1159E, K1161E, and K1174E (magenta) structures (rmsd = 0.485 Å for 381 atoms). (Right) Comparison between the DdMF2 WT (blue) and mutant #1 K1181E, R1882E, K1909E, K1912E, and K1913E structures (magenta, rmsd = 0.829 Å for 411 atoms). Note that a part of the N-terminal sequence of the mutant is not visible in electron density and not modeled (arrow). (B) Comparison of the crystal packing of DdMF1 WT (dark orange) and DdMF1 mutant #2 (light orange) structures. Symmetry molecules are in gray (DdMF1 WT) and pink (DdMF1 mutant #2). Note that the environment of the MF molecule differs in the two crystal forms. The position of the different domains (MyTH4 and the three FERM lobes F1, F2, and F3) found in the crystal is thus not greatly influenced by the interactions with other molecules in the crystal. (C) Comparison of the crystal packing of DdMF2 WT (dark blue) and mutant #1 structures (light blue, molecule A). Symmetry molecules of the DdMF2 WT molecule are in gray. Note that the asymmetric unit of the mutant includes two molecules; molecule B is shown in pink. The environment of the WT and the mutant molecules is clearly different. (D) The surface analysis shows a difference in the electrostatic potential between the WT and the mutant MFs that accounts for the difference in MT affinity.
Fig. 2.
Fig. 2.
Conservation of the MyTH4 domain and the MyTH4-FERM interface. (A) Ribbon representation of the MyTH4 domain from the crystallized MF domains. (Left) The core of the MyTH4 domain formed by a bundle of six helices (represented by the gray cylinders, from H1 to H6), which interacts with a conserved N-terminal linker (red) on one surface and with a C-terminal linker and helix H7 (cyan or blue) on the opposite surface. (Middle and Right) The nonconserved long inserts of different MyTH4 domains as well as the N-terminal regions (Nt) are represented using the indicated color code. See also Fig. S2A. The large insertions that are characteristic of the Myo10 and Myo7a classes, respectively, are displayed as M10-L0 (Myo10) and M7a-L1 (Myo7a) and cover the surface of the H1 and H2 helices. (B) Structure-based sequence alignment analysis of representative MyTH4 domains. Residues that are absolutely conserved are indicated in bold. Residues that are highly conserved are highlighted in yellow (hydrophobic residues), blue (positively charged), red (negatively charged), and green (other residues). The Cen2 binding pocket formed in part by the shorter H5 and H6 helices in mammalian Myo7a is indicated as Myo7 deletion (pink arrows). The last helix of the domain that serves as a linker and participates in the interface with the F1 lobe is indicated in black (H7). The conserved residues participating in this interface [Arg, Pro, and Glu (29)] are indicated with black circles. Note the longer linker before the H7 helix in DdMF2 (highlighted in violet) that modifies the orientation of this helix and the supramodule overall shape. Other myosin MyTH4 domains also have longer linkers that may affect the supramodule (Dataset S1). Residues shown to participate (solid stars) or are part of the MT binding surface (open stars) are indicated using the color code defined in A. The MF1, MF2, Hs, Aea, Gnp, Dd, and At abbreviations stand for N-terminal MyTH4-FERM domain, C-terminal MyTH4-FERM domain, Homo sapiens, Aedes aegypti, Gonapodya prolifera, Dictyostelium discoideum, and Arabidopsis thaliana, respectively.
Fig. S2.
Fig. S2.
Variable features of the MyTH4 domain. (A) The N-terminal variable region of Myo7a (pink), Myo10 (green), DdMF1 (orange), and DdMF2 (blue) are shown. This region is near the conserved N-ter linker and modifies the surface of the H3 and H5 helices. In DdMF1 and Myo7a MF1, it adopts a similar conformation and partially covers the H6 surface (black arrow). The N-terminal residue is indicated with a circle using the same color code. (B) Binding pocket in Myo7a for the CEN2 peptide as described (30) (Left). Some residues of the pocket are labeled. (Right) The same region in Myo10 (green) is shown for comparison. Note that the longer H5 and H6 helices in Myo10 and their slightly different orientation compared with Myo7a as well as the conformation of the H3.H4 linker close the cleft and thus prevent peptide binding to this surface in Myo10. (CE) The supramodule MyTH4-FERM interface differs in DdMF2 compared with DdMF1. (C) The C-ter linker that connects the H6 and H7 helices (cyan) strongly interacts with the MyTH4 and F1 domains (shown here for DdMF1). The strictly conserved arginine, proline, and glutamate (27) residues of the linker that stabilize the supramodule interface between the MyTH4 and FERM domains are also shown using sticks representation (R, E, and P, respectively). In D, the DdMF2 structure (blue) is superimposed on the DdMF1 structure (orange) using the F1 lobe as a reference. Note the difference in orientation of the H6, H4, and H2 helices that reflect the difference in orientation of the whole MyTH4 domain, relative to the F1 lobe. The H7 helix (black arrow) superimposes in both structures and interacts similarly with the F1 lobe. In E, the DdMF2 structure is compared with the DdMF1 structure using the core of the MyTH4 domain as a reference. Note the large differences in the C-ter linker position (blue and cyan) that result in a reorientation of the H7 helix together with the F1-lobe by ∼23°, represented here using the F1-H2 as a reference.
Fig. 3.
Fig. 3.
MF domain binding to MTs. (A) Conservation of the Myo10 MT binding motif. The residues previously implicated in MT binding in the Myo10 MyTH4 domain (27) are shown in light blue. The additionally identified residues participating in the interaction of the Myo10 MyTH4 domain are shown in dark blue (positively charged), yellow (tyrosine), and red (prolines). The organisms for this alignment are Homo sapiens (human), Bos taurus (bovine), Xenopus tropicalis (frog), Danio rerio (zebrafish), Ciona intestinalis (ciona), Monosiga brevicollis (monosiga), Capsaspora owczarzaki (capsaspora), and Dictyostelium discoideum (DdMF1 and DdMF2). (B and C) Equilibrium MT binding assays to measure the apparent binding affinity of the MF domains of DdMyo7 MF1 and MF2. (DF) Equilibrium MT binding assays to measure the apparent binding affinity of the MF domains of HsMyo10 [whole MF domain, MyTH4 alone, Myo10 binding to subtilisin-treated MTs (S-MTs)]. (G) Fractional binding of Myo10 MF with different MyTH4 mutants (see Table 1) at 2 µM tubulin polymer.
Fig. S3.
Fig. S3.
Identification of the MyTH4 MT binding sites. (A) Equilibrium MT binding assays to measure the binding affinity of the MF domains of HsMyo10 mutant #1. (BD) Identification of additional Myo10 MF residues required for MT binding. MT binding assays to identify the full MT binding site of Myo10 MF domain. Shown are examples of the binding analysis using SDS/PAGE (top) and quantification of the binding for two different concentrations of tubulin polymer at approximately half maximal or saturation binding (0. 5 µM and 2 µM, respectively). (B) Mutant #2 R1643A, K1647A, K1650E, K1654E, and R1657E. (C) Mutant #3 R1643A, K1647A, K1650E, R1657E, and R1600E. (D) Mutant #4 R1643A, K1647A, K1650E, P1546E, P1548E, and R1600E. (E) Mutant #5 P1546E, P1548E, and R1600E. (FH) MT binding assays to identify the MT binding sites of the DdMF1 and DdMF2 MF domains. Shown are representative examples of binding analysis using SDS/PAGE (top) and quantification of the binding for two different concentrations of tubulin polymer at approximately half maximal or saturation binding (1 and 7 µM for DdMF1; 0.5 and 2 µM, respectively, for DdMF2). (F) DdMF1 mutant #2 K1157E, H1159E, K1161E, and K1174E. (G) DdMF2 mutant #1 K1896E, K1900E, K1909E, and K1912E. (H) DdMF2 mutant #2 K1881E, R1882, K1909E, K1912E, and K1913E. (I) The DdMF1 and DdMF2 MT binding surfaces are different. Ribbon representation of the MT binding surface of DdMF1 (Left) and DdMF2 (Middle). The two surfaces are directly compared (Right) in the same orientation as in Fig. 4 B and C. Residues participating in MT binding are highlighted. Residues identified by mutagenesis are shown in dark colors (orange, DdMF1; blue, DdMF2) and other residues in this surface that could participate to the MT binding are in lighter colors.
Fig. 4.
Fig. 4.
The MT binding surfaces of distant MF myosins are distinct. (A) Surface representation of the MyTH4-FERM domain from human Myo10. The MT binding residues in the MyTH4 domains are highlighted using the same color code as in Fig. 3A. The central and right figures show the MyTH4 domain only. (B and C) Surface of the MyTH4 domain from DdMF1 (B) and DdMF2 (C). The sequence-predicted MT binding site (equivalent to that of Myo10) is shown in light blue with K1261. The MT binding residues identified by mutagenesis are shown in dark blue and the residues on this surface that likely participate in MT binding are in green (charged residues) and yellow (hydrophobic residues noted as P1 for P1898; I for I1915, Y for 1928, and P2 for P1929). Note that the MT binding site of the DdMF1 and DdMF2 are on the opposite surface compared with that of Myo10MF (light blue predicted residue).
Fig. S4.
Fig. S4.
Model of Myo10 MF binding to MT illustrating steric hindrance by DCC binding. (A) Electrostatic surface potential of a mammalian protofilament [Left (83)] and a D. discoideum homology-modeled protofilament [Right, Swiss model (46)]. Note the abundance of negative charges (red) on both surfaces. The C-terminal region of both α-tubulin and β-tubulin are indicated with gray and black arrows, respectively. (B and C) Model of the interaction between HsMyo10 MF (green, B), DdMF2 (light blue, C) and the MT (red/blue) using the MT binding surface identified in Fig. 4. Note that the binding would be impaired if the FERM domain was engaged in binding partners via the F3 lobe, such as DCC (pink) (mode ①). In DdMF2, different restrictions for cooperative binding of partners and MT sites would apply because the MT binding site is located on the opposite surface of the MyTH4 domain for this myosin MF domain, compared with that of Myo10.
Fig. 5.
Fig. 5.
Variability of the FERM domain. (A) Structural representation of the Myo10 MF domain with the conserved core of the MyTH4 and FERM lobes (gray) and the variable regions among FERM domains (in red, yellow, and cyan). Shown also is the Myo10 insert in the MyTH4 domain (green cylinder). The orientation (indicated schematically with cartoons on the right) was chosen to visualize the two opposite surfaces that show variability (red features on the same side as that of the M10-L0 MyTH4 insert, and yellow and blue on the opposite surface). A 120° view of this surface is shown in B (lower panel) to better visualize the opposite surface. (B) Representation of the MF domain (gray) in which the position of partners that have been cocrystallized with a FERM domain are shown (see Table S5). The four modes of binding to the FERM domain previously identified are indicated by ① through ④. Several partners have been shown to bind the C-terminal F3 lobe, most of them by extending the beta sheet near the S5 strand (mode ①). The interface between the three lobes (binding mode ④) is exploited by some partners, such as Cen1 and Heg1. The dashed line represents the rest of the CEN structure that is not modeled in the X-ray structure. (C) Note that the DdMF1 F3 structure is not compatible with the binding in mode ① due to a deformation of the S5 strand. (D) The extended cleft buried in between the three FERM lobes is drastically shortened at the interface between the F2-F3 lobes in Myo10 due to the specific F2-H2.H3 insertion (red). Note that steric hindrance would occur between this insertion and a peptide bound in the cleft, thus peptide binding in the cleft would require following a different path (black arrow).
Fig. 6.
Fig. 6.
Conservation of the FERM cloverleaf structure. (A) Major contacts between the lobes of the FERM domain. The cloverleaf configuration is stabilized by interlobe interactions as illustrated here on the DdMF1 structure (orange). The variable regions involved in these interactions are shown in red and yellow, except for the interlobe linkers shown in cyan (F1-F2) and green (F2-F3). Other less variable regions at the interface of the three lobes are shown in purple and blue (F2-H1 helix). The three major surfaces participating in the maintenance of the trilobe structure are shown in detail: The F1-F3 surface (①) is mainly maintained by hydrophobic interactions between the F1-S3.S4 loop, the F1-S4 strand and hydrophobic residues present in the F3-H1 surface; the F2-F3 surface (②) is formed by the F2-H1.H2 loop, the F2-F3 linker, and the F3-S2.S3 and F3-S3-S4 loops; and the F1-F2 interface (③) includes the F1-S1.S2 and F1-H1.S3 loops of the F1 lobe and the highly variable F1.F2 linker between these two lobes as well as the first helix (F2-H1) of the F2 lobe. (B) The DdMF2 structure is shown in purple, with the elements participating on the maintenance of the FERM structure highlighted using the same color code as in A. The F1 lobe is kept in the same position as in A, but note that the F2 and F3 lobes are displaced (black arrows, part of the DdMF1 lobes are shown in orange as a reference). The F1-F2 linker (cyan) is bigger in DdMF2, forcing the F2 lobe to rotate by ∼30° (black arrows), and this also changes the position of the F3 lobe. (C) Structure of the Talin FERM domain (35). Note how talin adopts an extended conformation, rather than the canonical trilobe FERM structure. The F1 lobe is represented in the same orientation as in A and B, but the F2 lobe position differ (black arrow). Note the difference in the F1.F2 linker (blue) that interacts with the F2 lobe. The position of a large (31 residues) and flexible F1-S3.S4 linker (see Fig. S5) not modeled in the crystal structure is indicated with a black star (the beginning and the end of the linker is indicated with a green and an orange dot, respectively). (D) Conformational dynamics of the FERM domain from molecular dynamics simulations. The plot shows the rmsd from the crystal structure of the backbone atoms of FERM lobes F1, F2, and F3 for DdMF1 (orange), DdMF2 (light blue), and talin (pink). The rmsd time series show that the cloverleaf organization of the myosin FERM is stable, whereas the talin FERM domain undergoes significantly higher fluctuations.
Fig. S5.
Fig. S5.
Structure-based alignment of representative FERM domains and molecular dynamics. (A) Residues that are absolutely conserved are indicated in bold. Residues that are highly conserved are highlighted in yellow (hydrophobic residues), blue (positively-charged), red (negatively-charged), and green (other residues). The variable regions between the conserved elements of each lobe are indicated in red, on top of the sequences. Residues present on the surfaces that participate in the maintenance of the cloverleaf structure (Fig. 6) are indicated with a magenta line below the sequences. Highlighted in orange is the F3-S5 strand that adopts a different conformation in DdMF1 as shown in Fig. 5C (note the absence of the conserved hydrophobic residues). The conserved insertion found in the F1 lobe of talin is indicated with a black line and a star below its sequence. The blue line below the sequence highlights the Myo7 regulation loop between the S6 and S7 strands of the MF2 F3 lobe. The conserved lysines in this loop are highlighted with blue circles. Interestingly, basic residues for this loop are not conserved for other myosins such as Myo10 MF (see also Fig. S6) and Myo15 MF2. (B) Rmsd of the backbone atoms of the secondary structure elements after least-square fit on the respective crystal structures. The average rmsd ± SD (angstroms) of the F1-F2-F3 assembly in molecular dynamics simulations is significantly higher in the elongated talin FERM than in myosin MF domains, which feature the cloverleaf organization. The high value observed for the F1-F2 linker in DdMF1 and DdMF2 is due to punctual rearrangements rather than higher flexibility, as demonstrated by the similar values in the rmsd standard deviations. The F2-F3 linker and the lobes themselves are conformationally stable.
Fig. S6.
Fig. S6.
The conserved MF2 autoinhibition loop. Comparison of the regulatory F3-S6.S7 loop in the F3 subdomain. Mutations in two conserved basic residues of this loop (blue spheres) in the Drosophila Myo7a MF2 domain cause the myosin to be constitutively active as they impede the head–tail interaction (26). These two lysines are conserved in the MF2 domains of Myo7s and Myo22, but not in their MF1 domains (Fig. S5). For comparison, the F3 lobe of the Myo10 is shown in magenta using the ribbon representation. Note that the F3-S6.S7 loop is smaller than in DdMF2. (Inset) A detail of the F3 lobe.

Similar articles

Cited by

References

    1. Jacob F. Evolution and tinkering. Science. 1977;196(4295):1161–1166. - PubMed
    1. Sweeney HL, Houdusse A. Structural and functional insights into the Myosin motor mechanism. Annu Rev Biophys. 2010;39:539–557. - PubMed
    1. Hartman MA, Finan D, Sivaramakrishnan S, Spudich JA. Principles of unconventional myosin function and targeting. Annu Rev Cell Dev Biol. 2011;27:133–155. - PMC - PubMed
    1. Pylypenko O, et al. Structural basis of myosin V Rab GTPase-dependent cargo recognition. Proc Natl Acad Sci USA. 2013;110(51):20443–20448. - PMC - PubMed
    1. Odronitz F, Kollmar M. Drawing the tree of eukaryotic life based on the analysis of 2,269 manually annotated myosins from 328 species. Genome Biol. 2007;8(9):R196. - PMC - PubMed

Publication types

LinkOut - more resources