. 2016 May 10;110(9):1993-2003.
doi: 10.1016/j.bpj.2016.03.035.

Protonation Dynamics on Lipid Nanodiscs: Influence of the Membrane Surface Area and External Buffers

Affiliations

Protonation Dynamics on Lipid Nanodiscs: Influence of the Membrane Surface Area and External Buffers

Lei Xu et al. Biophys J. .

Abstract

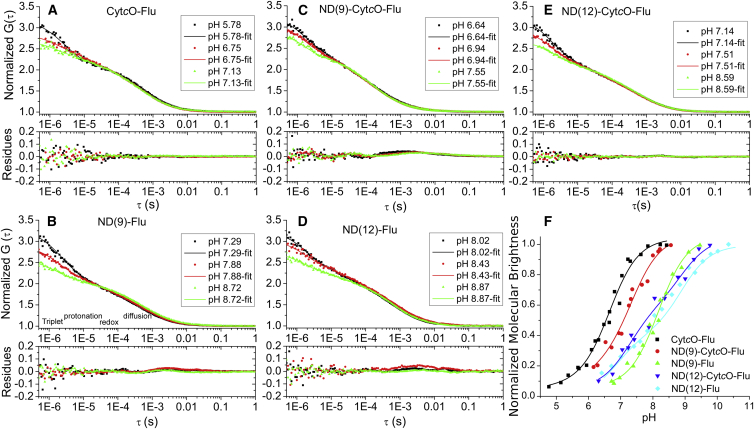
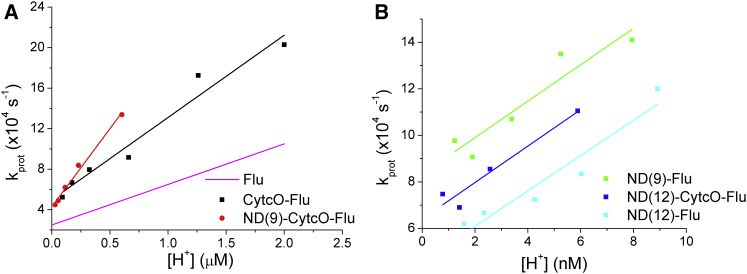
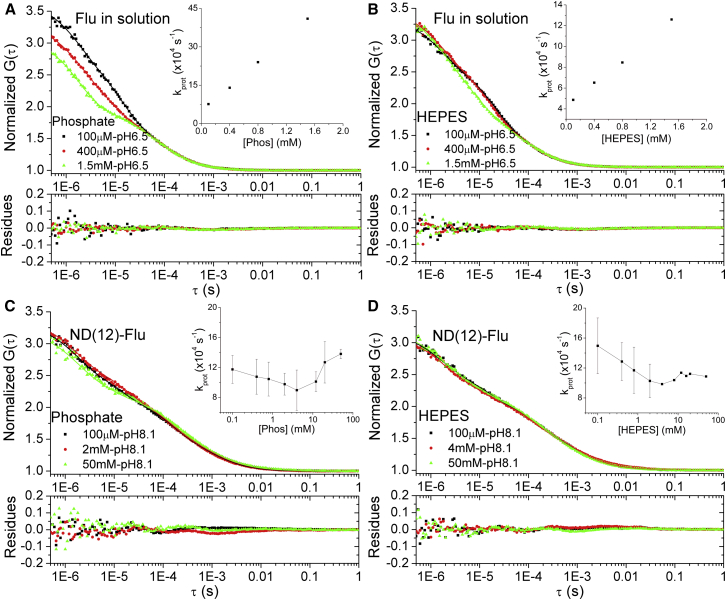
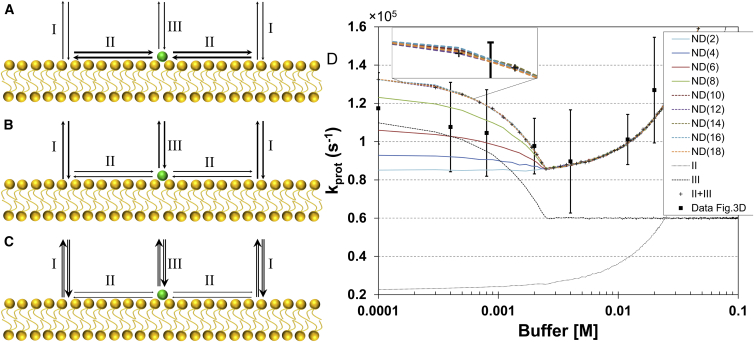
Lipid membrane surfaces can act as proton-collecting antennae, accelerating proton uptake by membrane-bound proton transporters. We investigated this phenomenon in lipid nanodiscs (NDs) at equilibrium on a local scale, analyzing fluorescence fluctuations of individual pH-sensitive fluorophores at the membrane surface by fluorescence correlation spectroscopy (FCS). The protonation rate of the fluorophores was ∼100-fold higher when located at 9- and 12-nm diameter NDs, compared to when in solution, indicating that the proton-collecting antenna effect is maximal already for a membrane area of ∼60 nm(2). Fluorophore-labeled cytochrome c oxidase displayed a similar increase when reconstituted in 12 nm NDs, but not in 9 nm NDs, i.e., an acceleration of the protonation rate at the surface of cytochrome c oxidase is found when the lipid area surrounding the protein is larger than 80 nm(2), but not when below 30 nm(2). We also investigated the effect of external buffers on the fluorophore proton exchange rates at the ND membrane-water interfaces. With increasing buffer concentrations, the proton exchange rates were found to first decrease and then, at millimolar buffer concentrations, to increase. Monte Carlo simulations, based on a simple kinetic model of the proton exchange at the membrane-water interface, and using rate parameter values determined in our FCS experiments, could reconstruct both the observed membrane-size and the external buffer dependence. The FCS data in combination with the simulations indicate that the local proton diffusion coefficient along a membrane is ∼100 times slower than that observed over submillimeter distances by proton-pulse experiments (Ds ∼ 10(-5)cm(2)/s), and support recent theoretical studies showing that proton diffusion along membrane surfaces is time- and length-scale dependent.


Figures

Figure 1
Figure 1
Normalized FCS curves (with N set to unity), recorded at different pH and from the different ND samples. The curves were recorded at pH values in parity with, or higher than, the pKa values of fluorescein in the different samples, in a pH range where the membrane has been previously found to be fully active as a proton-collecting antenna (21). The curves were fitted to Eq. 1 (solid lines), with the fitting residuals given below the curves. (A) Fluorescein-labeled CytcO in detergent solution, CytcO-flu. (B) Fluorescein attached directly to DOPG NDs with a diameter of 9 nm, ND(9)-flu. (C) Fluorescein-labeled CytcO incorporated into DOPG NDs with a diameter of 9 nm, ND(9)-CytcO-flu. (D) Fluorescein attached directly to DOPG NDs with a diameter of 12 nm, ND(12)-flu. (E) Fluorescein-labeled CytcO incorporated into DOPG NDs with a diameter of 12 nm, ND(12)-CytcO-flu. (F) Molecular brightness of fluorescein at different pH values, as determined from FCS experiments, and with the pH titration curves fitted to Eq. 3. CytcO-flu (black), pKa (1) = 5.0 (3.5% of the total amplitude) and pKa (2) = 6.6 (96.5% of the total amplitude); ND(9)-CytcO-flu (red), pKa (1) = 6.0 (14.5% of the total amplitude) and pKa (2) = 7.2 (85.5% of the total amplitude); ND(9)-flu (green), pKa (1) = 7.3 (10% of the total amplitude) and pKa (2) = 8.1 (90% of the total amplitude); ND(12)-CytcO-flu (blue), pKa (1) = 7.3 (52% of the total amplitude) and pKa (2) = 8.8 (48% of the total amplitude); and ND(12)-flu (cyan), pKa (1) = 6.8 (41% of the total amplitude) and pKa (2) = 8.7 (59% of the total amplitude). To see this figure in color, go online.
Figure 2
Figure 2
Protonation relaxation rates of fluorescein, kprot, as retrieved from FCS experiments, and as a function of bulk proton concentration, [H+]. (A) kprot versus [H+] for CytcO-fluorescein (black), ND(9)-CytcO-fluorescein (red), and free fluorescein (magenta, curve made by taking values from Widengren et al. (18)). (B) kprot versus [H+] for ND (9)-fluorescein (green), ND(12)-CytcO-fluorescein (blue), and ND(12)-CytcO-fluorescein (cyan). The proton on- and off-rates extracted from two to three independent experiments for each case done in this article and from reference are given in Table 1. To see this figure in color, go online.
Figure 3
Figure 3
Normalized fluorescence correlation curves recorded from free fluorescein and from ND(12)-flu at different buffer concentrations. The curves were fitted to Eq. 1 (solid lines), with the fitting residuals given below the curves. (A) Fluorescein in phosphate buffer at pH 6.5. (B) Fluorescein in HEPES buffer at pH 6.5. (C) ND(12)-flu in phosphate buffer at pH 8.1. (D) ND (12)-flu in HEPES buffer at pH 8. To see this figure in color, go online.
Figure 4
Figure 4
Proposed mechanism for the observed membrane protonation dynamics dependence on the bulk buffer concentration. Three major proton exchange pathways are considered, i.e., proton exchange between the membrane and the bulk solution (I), proton migration along membrane surface with subsequent proton exchange between the surface and the fluorophore (II), and direct proton exchange between the membrane bound fluorescein molecule and the bulk (III). Only the sum of the protonation relaxation rates of the pathways II and III are accessible by FCS measurements. Thickness of arrows represents the magnitude of the proton exchange rates. (A) The proton exchange rates at low buffer concentrations (<1 mM). (B) Proton exchange rates at medium buffer concentrations (∼4 mM). (C) Proton exchange rates at high buffer concentrations (>10 mM). (D) Monte Carlo simulations of the phosphate buffer concentration dependence of kprot for fluorescein-labeled NDs of different diameters (see the Supporting Material for further details and parameter values used in the simulations). Apart from the overall dependence of the experimentally accessible protonation relaxation rate kprot = (II+III), the dependence of the protonation relaxation rates of the individual pathways II and III on the bulk buffer concentration is also shown. The differences in the simulated curves for ND (10)-ND (18) are so small that they would not be experimentally discernible (magnified inset). (Black squares) Experimental data for kprot for ND (12)-flu (from inset of Fig. 3C), with standard deviations given by the error bars. To see this figure in color, go online.

Comment in

Similar articles

Cited by

References

    1. Medvedev E.S., Stuchebrukhov A.A. Mechanism of long-range proton translocation along biological membranes. FEBS Lett. 2013;587:345–349. - PMC - PubMed
    1. Sackes V., Marantz Y., Gutman M. The dynamic feature of the proton collecting antenna of a protein surface. Biochim. Biophys. Acta. 1998;1365:232–240.
    1. Ädelroth P., Brzezinski P. Surface-mediated proton-transfer reactions in membrane-bound proteins. Biochim. Biophys. Acta. 2004;1655:102–115. - PubMed
    1. Heberle J. Proton transfer reactions across bacteriorhodopsin and along the membrane. Biochim. Biophys. Acta. 2000;1458:135–147. - PubMed
    1. Mulkidjanian A.Y., Heberle J., Cherepanov D.A. Protons @ interfaces: implications for biological energy conversion. Biochim. Biophys. Acta. 2006;1757:913–930. - PubMed

Publication types

LinkOut - more resources