

Motor Protein Accumulation on Antiparallel Microtubule Overlaps
- PMID: 27166811
- PMCID: PMC4940618
- DOI: 10.1016/j.bpj.2016.03.039
Motor Protein Accumulation on Antiparallel Microtubule Overlaps
Abstract
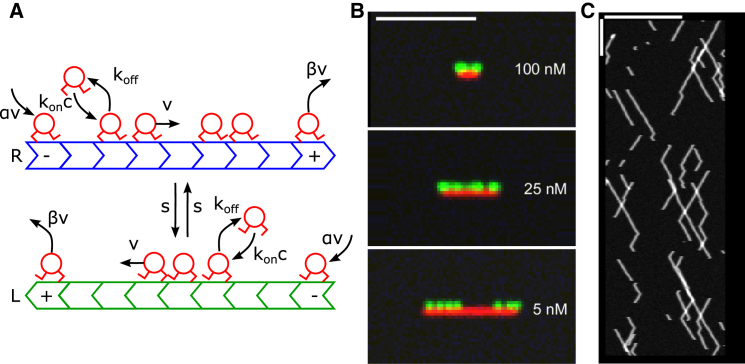
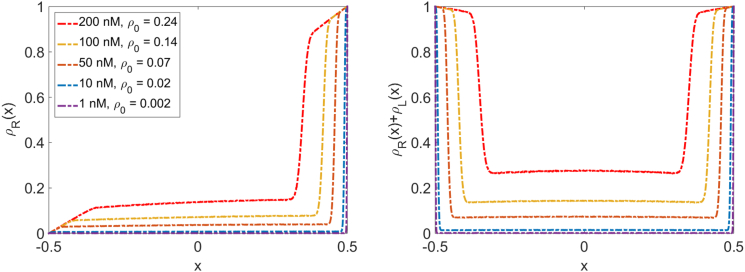
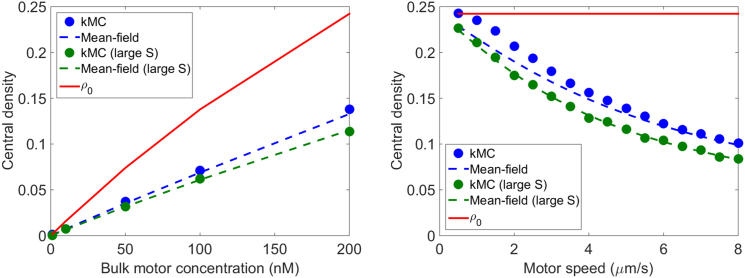
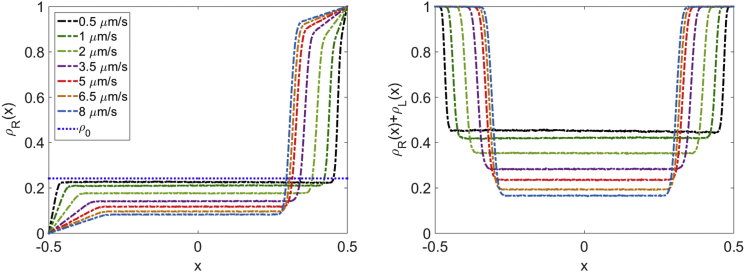
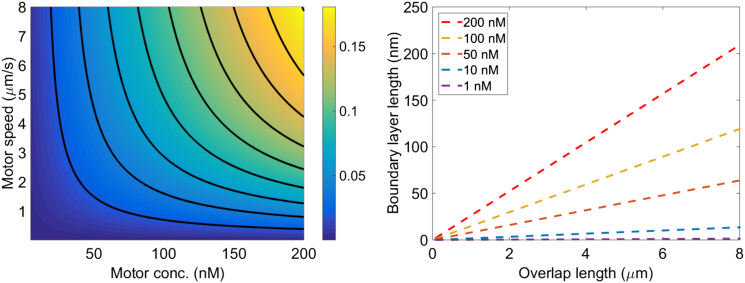
Biopolymers serve as one-dimensional tracks on which motor proteins move to perform their biological roles. Motor protein phenomena have inspired theoretical models of one-dimensional transport, crowding, and jamming. Experiments studying the motion of Xklp1 motors on reconstituted antiparallel microtubule overlaps demonstrated that motors recruited to the overlap walk toward the plus end of individual microtubules and frequently switch between filaments. We study a model of this system that couples the totally asymmetric simple exclusion process for motor motion with switches between antiparallel filaments and binding kinetics. We determine steady-state motor density profiles for fixed-length overlaps using exact and approximate solutions of the continuum differential equations and compare to kinetic Monte Carlo simulations. Overlap motor density profiles and motor trajectories resemble experimental measurements. The phase diagram of the model is similar to the single-filament case for low switching rate, while for high switching rate we find a new (to our knowledge) low density-high density-low density-high density phase. The overlap center region, far from the overlap ends, has a constant motor density as one would naïvely expect. However, rather than following a simple binding equilibrium, the center motor density depends on total overlap length, motor speed, and motor switching rate. The size of the crowded boundary layer near the overlap ends is also dependent on the overlap length and switching rate in addition to the motor speed and bulk concentration. The antiparallel microtubule overlap geometry may offer a previously unrecognized mechanism for biological regulation of protein concentration and consequent activity.
Copyright © 2016 Biophysical Society. Published by Elsevier Inc. All rights reserved.
Figures
Similar articles
-
Phase-plane analysis of the totally asymmetric simple exclusion process with binding kinetics and switching between antiparallel lanes.Phys Rev E. 2016 Aug;94(2-1):022419. doi: 10.1103/PhysRevE.94.022419. Epub 2016 Aug 29. Phys Rev E. 2016. PMID: 27627345 Free PMC article.
-
Driven transport on open filaments with interfilament switching processes.Phys Rev E. 2017 Feb;95(2-1):022417. doi: 10.1103/PhysRevE.95.022417. Epub 2017 Feb 28. Phys Rev E. 2017. PMID: 28298001
-
Changes in microtubule overlap length regulate kinesin-14-driven microtubule sliding.Nat Chem Biol. 2017 Dec;13(12):1245-1252. doi: 10.1038/nchembio.2495. Epub 2017 Oct 16. Nat Chem Biol. 2017. PMID: 29035362 Free PMC article.
-
Bidirectional transport along microtubules.Curr Biol. 2004 Jul 13;14(13):R525-37. doi: 10.1016/j.cub.2004.06.045. Curr Biol. 2004. PMID: 15242636 Review.
-
Fluorescence microscopy assays on chemically functionalized surfaces for quantitative imaging of microtubule, motor, and +TIP dynamics.Methods Cell Biol. 2010;95:555-80. doi: 10.1016/S0091-679X(10)95028-0. Methods Cell Biol. 2010. PMID: 20466153 Review.
Cited by
-
Modeling spatiotemporally varying protein-protein interactions in CyLaKS, the Cytoskeleton Lattice-based Kinetic Simulator.Eur Phys J E Soft Matter. 2021 Aug 18;44(8):105. doi: 10.1140/epje/s10189-021-00097-8. Eur Phys J E Soft Matter. 2021. PMID: 34406510 Free PMC article.
-
Phase-plane analysis of the totally asymmetric simple exclusion process with binding kinetics and switching between antiparallel lanes.Phys Rev E. 2016 Aug;94(2-1):022419. doi: 10.1103/PhysRevE.94.022419. Epub 2016 Aug 29. Phys Rev E. 2016. PMID: 27627345 Free PMC article.
-
Geometry of antiparallel microtubule bundles regulates relative sliding and stalling by PRC1 and Kif4A.Elife. 2018 Oct 24;7:e32595. doi: 10.7554/eLife.32595. Elife. 2018. PMID: 30353849 Free PMC article.
-
Enhanced Dynamics of Confined Cytoskeletal Filaments Driven by Asymmetric Motors.Biophys J. 2017 Sep 5;113(5):1121-1132. doi: 10.1016/j.bpj.2017.07.016. Biophys J. 2017. PMID: 28877494 Free PMC article.
-
Motor guidance by long-range communication on the microtubule highway.Proc Natl Acad Sci U S A. 2022 Jul 12;119(28):e2120193119. doi: 10.1073/pnas.2120193119. Epub 2022 Jul 7. Proc Natl Acad Sci U S A. 2022. PMID: 35867749 Free PMC article.
References
-
- Bray D. Routledge; New York: 2000. Cell Movements: from Molecules to Motility.
-
- Kolomeisky A.B. CRC Press; Boca Raton, FL: 2015. Motor Proteins and Molecular Motors.
-
- Helbing D. Traffic and related self-driven many-particle systems. Rev. Mod. Phys. 2001;73:1067–1141.
-
- Parmeggiani A., Franosch T., Frey E. Totally asymmetric simple exclusion process with Langmuir kinetics. Phys. Rev. E Stat. Nonlin. Soft Matter Phys. 2004;70:046101. - PubMed
Publication types
MeSH terms
Substances
Grants and funding
LinkOut - more resources
Full Text Sources
Other Literature Sources
