

Analysis of Translation Elongation Dynamics in the Context of an Escherichia coli Cell
- PMID: 27166819
- PMCID: PMC4940617
- DOI: 10.1016/j.bpj.2016.04.004
Analysis of Translation Elongation Dynamics in the Context of an Escherichia coli Cell
Abstract
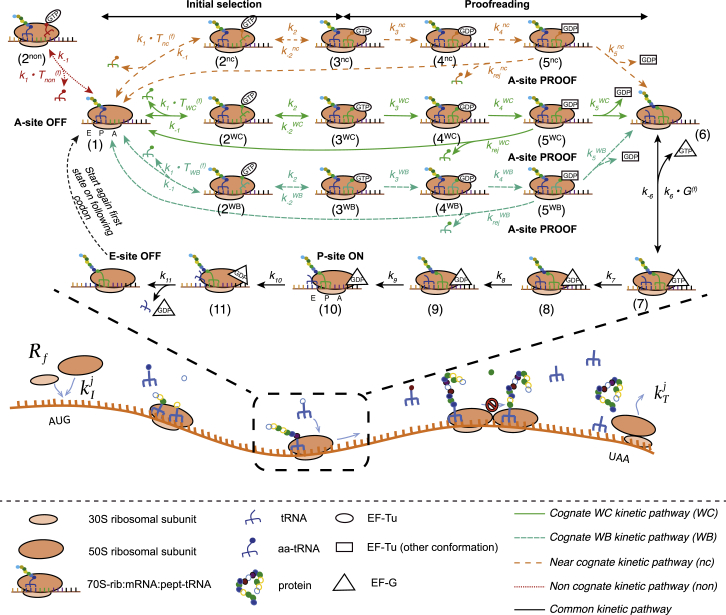
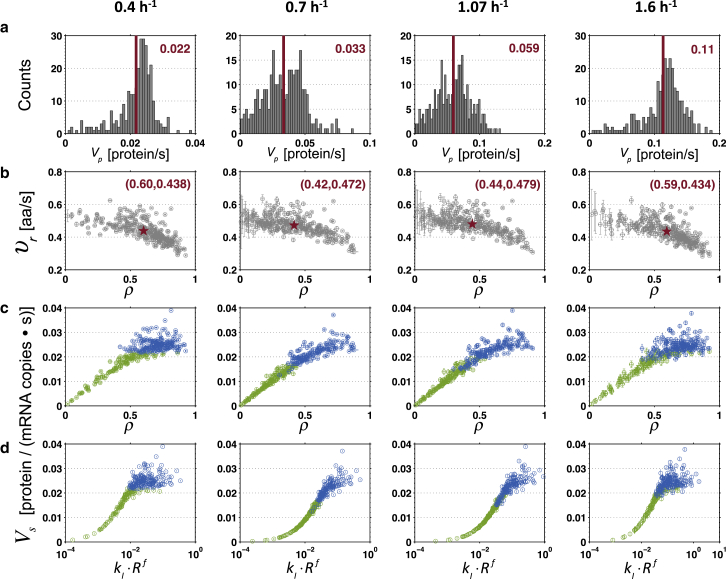
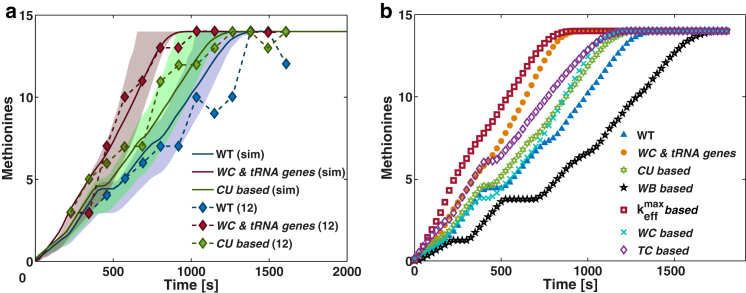
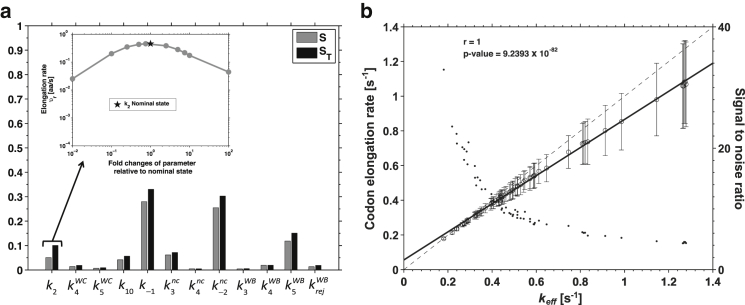
Understanding the mechanisms behind translation and its rate-limiting steps is crucial for both the development of drug targets and improvement of heterologous protein production with many biotechnological applications, such as in pharmaceutical and biofuel industries. Despite many advances in the knowledge of the ribosome structure and function, there is still much discussion around the determinants of translation elongation with experiments and computational studies pointing in different directions. Here, we use a stochastic framework to simulate the process of translation in the context of an Escherichia coli cell by gathering the available biochemical data into a ribosome kinetics description. Our results from the study of translation in E. coli at different growth rates contradict the increase of mean elongation rate with growth rate established in the literature. We show that both the level of tRNA competition and the type of cognate binding interaction contribute to the modulation of elongation rate, and that optimization of a heterologous transcript for faster elongation rate is achieved by combining the two. We derive an equation that can accurately predict codon elongation rates based on the abundances of free tRNA in the cell, and can be used to assist transcript design. Finally, we show that non-cognate tRNA-ribosome binding has an important weight in translation, and plays an active role in the modulation of mean elongation rate as shown by our amino-acid starvation/surplus studies.
Copyright © 2016 Biophysical Society. Published by Elsevier Inc. All rights reserved.
Figures
Similar articles
-
Protein Synthesis in E. coli: Dependence of Codon-Specific Elongation on tRNA Concentration and Codon Usage.PLoS One. 2015 Aug 13;10(8):e0134994. doi: 10.1371/journal.pone.0134994. eCollection 2015. PLoS One. 2015. PMID: 26270805 Free PMC article.
-
Ribosome kinetics and aa-tRNA competition determine rate and fidelity of peptide synthesis.Comput Biol Chem. 2007 Oct;31(5-6):335-46. doi: 10.1016/j.compbiolchem.2007.07.003. Epub 2007 Aug 15. Comput Biol Chem. 2007. PMID: 17897886 Free PMC article.
-
Full-length ribosome density prediction by a multi-input and multi-output model.PLoS Comput Biol. 2021 Mar 26;17(3):e1008842. doi: 10.1371/journal.pcbi.1008842. eCollection 2021 Mar. PLoS Comput Biol. 2021. PMID: 33770074 Free PMC article.
-
Optimizing scaleup yield for protein production: Computationally Optimized DNA Assembly (CODA) and Translation Engineering.Biotechnol Annu Rev. 2007;13:27-42. doi: 10.1016/S1387-2656(07)13002-7. Biotechnol Annu Rev. 2007. PMID: 17875472 Review.
-
Controlling translation elongation efficiency: tRNA regulation of ribosome flux on the mRNA.Biochem Soc Trans. 2014 Feb;42(1):160-5. doi: 10.1042/BST20130132. Biochem Soc Trans. 2014. PMID: 24450645 Review.
Cited by
-
Modeling Cell-Free Protein Synthesis Systems-Approaches and Applications.Front Bioeng Biotechnol. 2020 Oct 28;8:584178. doi: 10.3389/fbioe.2020.584178. eCollection 2020. Front Bioeng Biotechnol. 2020. PMID: 33195146 Free PMC article. Review.
-
Structures of the eukaryotic ribosome and its translational states in situ.Nat Commun. 2022 Dec 2;13(1):7435. doi: 10.1038/s41467-022-34997-w. Nat Commun. 2022. PMID: 36460643 Free PMC article.
-
A combination of mRNA features influence the efficiency of leaderless mRNA translation initiation.NAR Genom Bioinform. 2021 Sep 23;3(3):lqab081. doi: 10.1093/nargab/lqab081. eCollection 2021 Sep. NAR Genom Bioinform. 2021. PMID: 34568822 Free PMC article.
-
First-principles model of optimal translation factors stoichiometry.Elife. 2021 Sep 30;10:e69222. doi: 10.7554/eLife.69222. Elife. 2021. PMID: 34590582 Free PMC article.
-
On the response of elongating ribosomes to forces opposing translocation.Biophys J. 2024 Sep 17;123(18):3010-3023. doi: 10.1016/j.bpj.2024.05.032. Epub 2024 Jun 6. Biophys J. 2024. PMID: 38845199
References
-
- Crombie T., Boyle J.P., Brown A.J. The folding of the bifunctional TRP3 protein in yeast is influenced by a translational pause which lies in a region of structural divergence with Escherichia coli indoleglycerol-phosphate synthase. Eur. J. Biochem. 1994;226:657–664. - PubMed
-
- Komar A.A., Lesnik T., Reiss C. Synonymous codon substitutions affect ribosome traffic and protein folding during in vitro translation. FEBS Lett. 1999;462:387–391. - PubMed
-
- Komar A.A., Jaenicke R. Kinetics of translation of γ-B crystallin and its circularly permutated variant in an in vitro cell-free system: possible relations to codon distribution and protein folding. FEBS Lett. 1995;376:195–198. - PubMed
-
- Myasnikov A.G., Simonetti A., Klaholz B.P. Structure-function insights into prokaryotic and eukaryotic translation initiation. Curr. Opin. Struct. Biol. 2009;19:300–309. - PubMed
MeSH terms
Substances
LinkOut - more resources
Full Text Sources
Other Literature Sources
