. 2016 May 11:7:11535.
doi: 10.1038/ncomms11535.

A microfluidics-based in vitro model of the gastrointestinal human-microbe interface

Affiliations

A microfluidics-based in vitro model of the gastrointestinal human-microbe interface

Pranjul Shah et al. Nat Commun. .

Abstract

Changes in the human gastrointestinal microbiome are associated with several diseases. To infer causality, experiments in representative models are essential, but widely used animal models exhibit limitations. Here we present a modular, microfluidics-based model (HuMiX, human-microbial crosstalk), which allows co-culture of human and microbial cells under conditions representative of the gastrointestinal human-microbe interface. We demonstrate the ability of HuMiX to recapitulate in vivo transcriptional, metabolic and immunological responses in human intestinal epithelial cells following their co-culture with the commensal Lactobacillus rhamnosus GG (LGG) grown under anaerobic conditions. In addition, we show that the co-culture of human epithelial cells with the obligate anaerobe Bacteroides caccae and LGG results in a transcriptional response, which is distinct from that of a co-culture solely comprising LGG. HuMiX facilitates investigations of host-microbe molecular interactions and provides insights into a range of fundamental research questions linking the gastrointestinal microbiome to human health and disease.


Conflict of interest statement

The authors have a corresponding patent application (WO/2013/144253), which is currently pending.

Figures
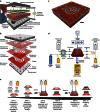
Figure 1
Figure 1. The HuMiX model.
(a) Conceptual diagram of the HuMiX model for the representative co-culture of human epithelial cells with gastrointestinal microbiota. (b) Annotated exploded view of the HuMiX device. The device is composed of a modular stacked assembly of elastomeric gaskets (thickness: 700 μm) sandwiched between two polycarbonate (PC) enclosures, and each gasket defines a distinct spiral-shaped microchannel with the following characteristics: length of 200 mm, width of 4 mm and height of 0.5 mm, amounting to a total volume of 400 μl per channel. Semi-permeable membranes affixed to the elastomeric gaskets demarcate the channels. The pore sizes of the membranes were chosen for their intended functionality. A microporous membrane (pore diameter of 1 μm), which allows diffusion-dominant perfusion to the human cells, is used to partition the perfusion and human microchambers. A nanoporous membrane (pore diameter of 50 nm) partitions the human and microbial microchambers to prevent the infiltration of microorganisms, including viruses, into the human microchamber. (c) Photograph of the assembled HuMiX device (scale bar, 1 cm). (d) Diagram of the experimental set-up of the HuMiX model with provisions for the perfusion of dedicated oxic and anoxic culture media as well as the monitoring of the oxygen concentration and transepithelial electrical resistance. The oxygen concentration in the anoxic medium is maintained at 0.1% by continuously bubbling the medium with dinitrogen gas. (e) Diagrammatic overview of the HuMiX co-culture protocol.
Figure 2
Figure 2. In vitro co-culture of human and microbial cells inside the HuMiX device.
(a) Characterisation of epithelial cell monolayer formation in HuMiX in comparison with the standard Transwell system. In both cases, the transepithelial electrical resistance (TEER) was determined on 7-day-old Caco-2 cell layers using standard chopstick electrodes. The error bars indicate the s.e.m. (n=3). * Indicates a statistically significant difference (paired Student's t-test, P<0.05). (b) Immunofluorescent microscopic observation of the tight junction protein occludin (green) in Caco-2 cells following 24 h of co-culture with LGG grown under anaerobic conditions. The cell nuclei are stained with 4,6-diamidino-2-phenylindole and appear in blue. (c,d) Viability assessment of Caco-2 cells and LGG at 24 h post co-culture, respectively. The cells were stained using a live–dead stain and observed using a fluorescence microscope. The live cells appear in green, whereas the dead cells appear in red. The collagen-coated microporous membrane does support the attachment and proliferation of the Caco-2 cells, whereas the mucin-coated nanoporous membrane provides a surface for the attachment and subsequent proliferation of the bacteria. (e) Representative electropherogram of an RNA fraction obtained from the Caco-2 cells co-cultured in HuMiX. The RNA Integrity Number (RIN) is provided. (f) Sampled eluates from the HuMiX device following a 24 h co-culture with LGG. (g) Oxygen concentration profiles within the perfusion and microbial microchambers upon initiation of the co-culture with LGG. ⋄indicates the pre-inoculation oxygen concentration of 2.6% in the microbial microchamber. (h) The relative abundances (in %) of Lactobacillus spp. and Bacteroides spp. following 24 h of co-culture with Caco-2 cells determined by 16S rRNA gene amplicon sequencing (n=4). Scale bars, 10 μm (bd).
Figure 3
Figure 3. Validation of the HuMiX model by transcriptomic, metabolomics and immunological analyses.
(a) Heat map highlighting the top 30 differentially expressed genes and miRNAs in Caco-2 cells co-cultured with LGG growing under anaerobic conditions compared with their corresponding LGG-free controls (n=3). The threshold parameters used were FC>2 and P<0.01, as determined using the empirical Bayes moderated t-statistic. Ranking was based on the π-values calculated using the log-fold changes and P values (BtS). An average linkage hierarchical clustering with the Euclidean distance metric was performed to determine the ordering of the genes. (b) Extracellular CCL20/MIP3A and IL-8 cytokine levels before and 24 h after the initiation of co-culture with LGG. Eluate samples were obtained from the perfusion microchamber (n=3). (c) Heat map of intracellular metabolites from Caco-2 cells co-cultured with LGG growing under anaerobic conditions compared with their corresponding LGG-free controls (n=3). The threshold parameter used was P<0.1 (StT). An average linkage hierarchical clustering with the Euclidean distance metric was performed to determine the ordering of the metabolites.
Figure 4
Figure 4. Transcriptional and metabolic changes induced in human cells following their co-culture with LGG and B. caccae.
(a) Heat map highlighting the top 30 differentially expressed genes and miRNAs in Caco-2 cells co-cultured with either LGG alone or LGG and B. caccae growing under anaerobic conditions compared with their bacteria-free controls (n=3). The threshold parameters used were FC>2 and P<0.01, as determined using the empirical Bayes moderated t-statistic. Ranking was based on the π-values calculated using the log-fold changes and P values (BtS). An average linkage hierarchical clustering with the Euclidean distance metric was performed to determine the ordering of the genes. (b) Venn diagram comparing the gene expression patterns obtained when Caco-2 cells were co-cultured with LGG or with a consortium of LGG and B. caccae growing under anaerobic conditions. The threshold parameters used were FC>1.5 and P<0.01 (BtS). (c) Heat map of intracellular metabolites from Caco-2 cells co-cultured with LGG and B. caccae growing under anaerobic conditions in comparison with monocultures of Caco-2 cells for which anaerobic medium was perfused through the microbial microchamber. The threshold parameter used was P<0.1 (StT). An average linkage hierarchical clustering with the Euclidean distance metric was performed to determine the ordering of the metabolites.
Figure 5
Figure 5. Anaerobic or aerobic bacterial culture differentially affects human transcriptional responses.
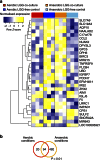
(a) Heat map representing the top 30 genes and miRNAs that exhibit opposite expression patterns in Caco-2 cells when co-cultured with LGG growing under either anaerobic or aerobic conditions compared with their respective LGG-free controls. The ranking was based on the π-values calculated using log-fold changes and P values (BtS). An average linkage hierarchical clustering with the Euclidean distance metric was performed to determine the ordering of the genes. (b) Venn diagram comparing the numbers of genes differentially expressed by Caco-2 cells following their co-culture with LGG growing under anaerobic or aerobic conditions. The threshold parameters used were FC>1.5 and P<0.01 (BtS).
Figure 6
Figure 6. Co-culture regime-specific miRNA expression.
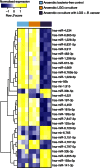
Heat map of the top 30 statistically significant differentially expressed genes in Caco-2 cells when comparing their expression after co-culture with LGG, LGG and B. caccae and their corresponding bacteria-free controls. The threshold parameters used were FC>1.5 and P<0.05 (BtS). An average linkage hierarchical clustering with the Euclidean distance metric was performed to determine the ordering of the genes.

References

    1. Hollister E. B., Gao C. & Versalovic J. Compositional and functional features of the gastrointestinal microbiome and their effects on human health. Gastroenterology 146, 1449–1458 (2014). - PMC - PubMed
    1. Gerber G. K. The dynamic microbiome. FEBS Lett. 588, 4131–4139 (2014). - PubMed
    1. Knip M. & Siljander H. The role of the intestinal microbiota in type 1 diabetes mellitus. Nat. Rev. Endocrinol. 12, 154–167 (2016). - PubMed
    1. Zhao L. The gut microbiota and obesity: from correlation to causality. Nat. Rev. Microbiol. 11, 639–647 (2013). - PubMed
    1. Morgan X. C. et al. Dysfunction of the intestinal microbiome in inflammatory bowel disease and treatment. Genome Biol. 13, R79 (2012). - PMC - PubMed

Publication types