. 2016 May 11;12(5):e1005586.
doi: 10.1371/journal.ppat.1005586. eCollection 2016 May.

TAC102 Is a Novel Component of the Mitochondrial Genome Segregation Machinery in Trypanosomes

Affiliations

TAC102 Is a Novel Component of the Mitochondrial Genome Segregation Machinery in Trypanosomes

Roman Trikin et al. PLoS Pathog. .

Erratum in

Abstract

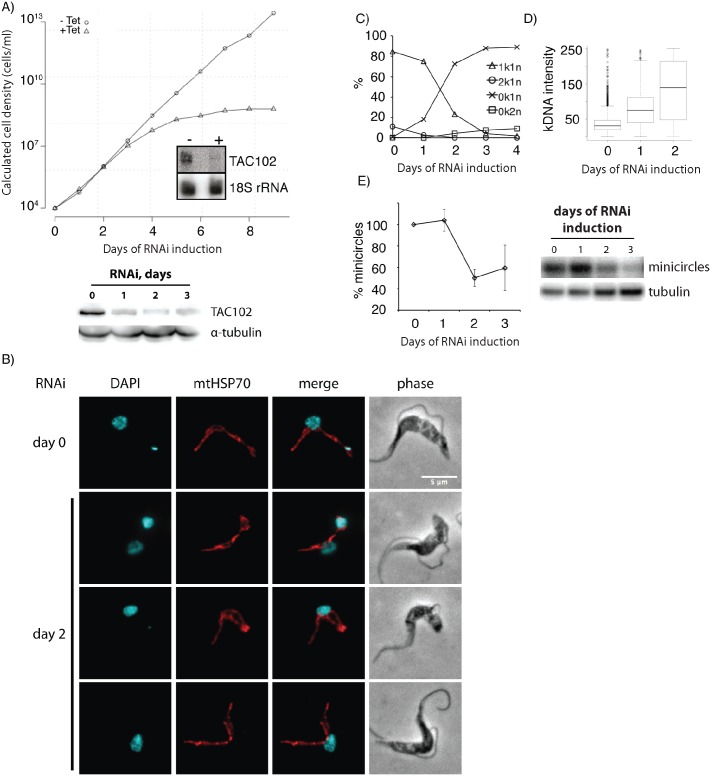
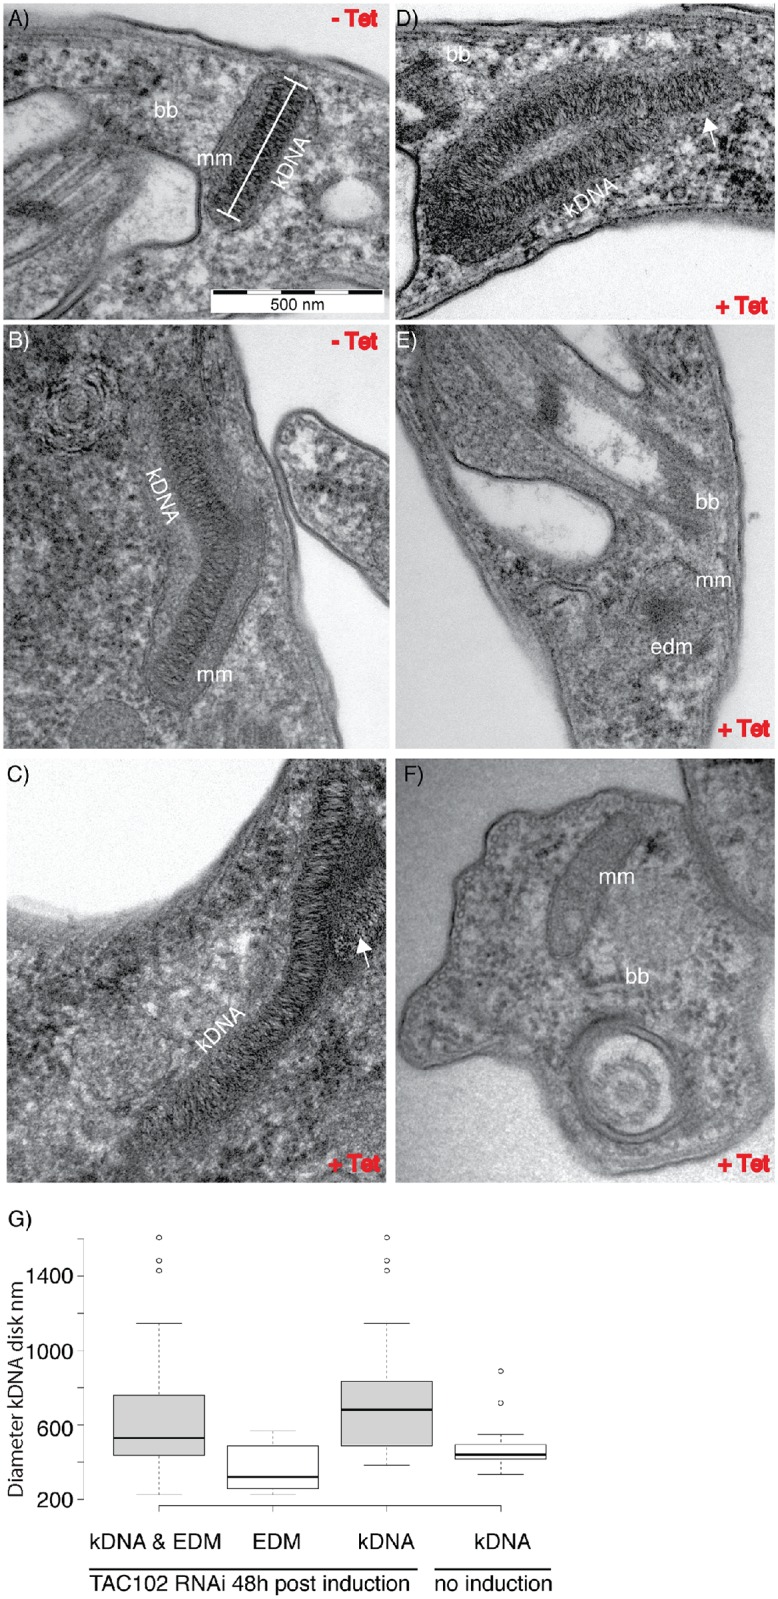
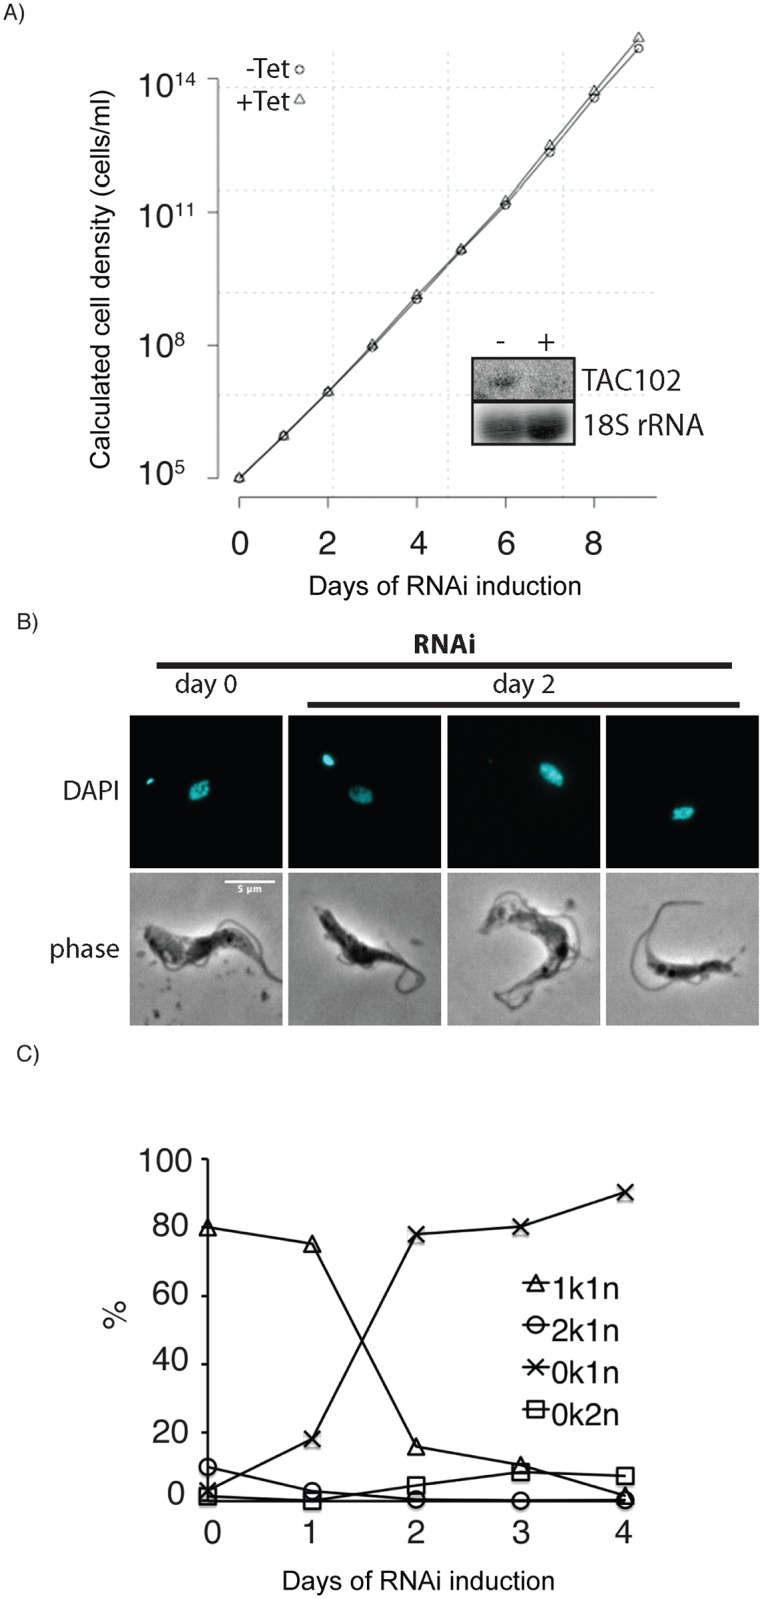
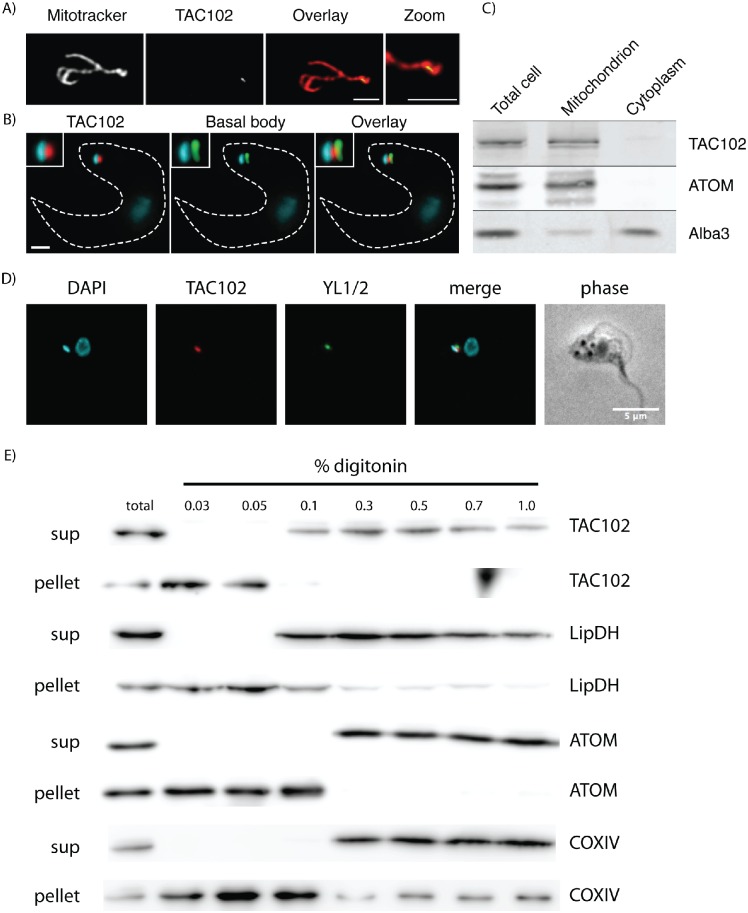
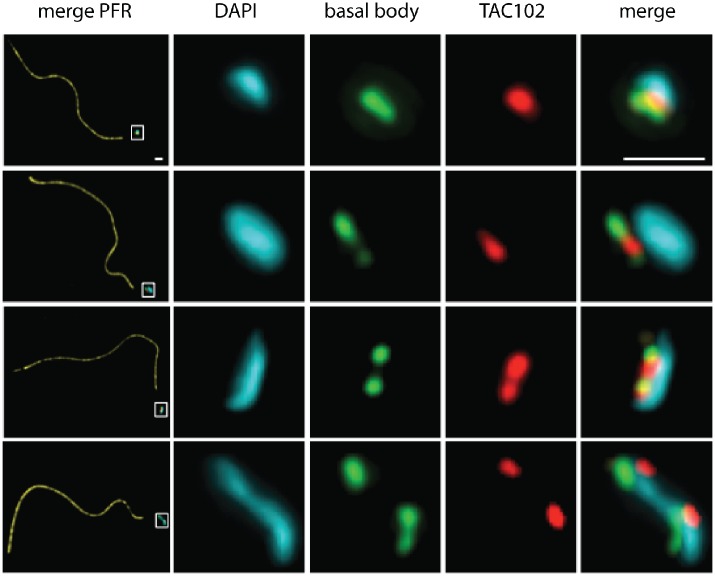
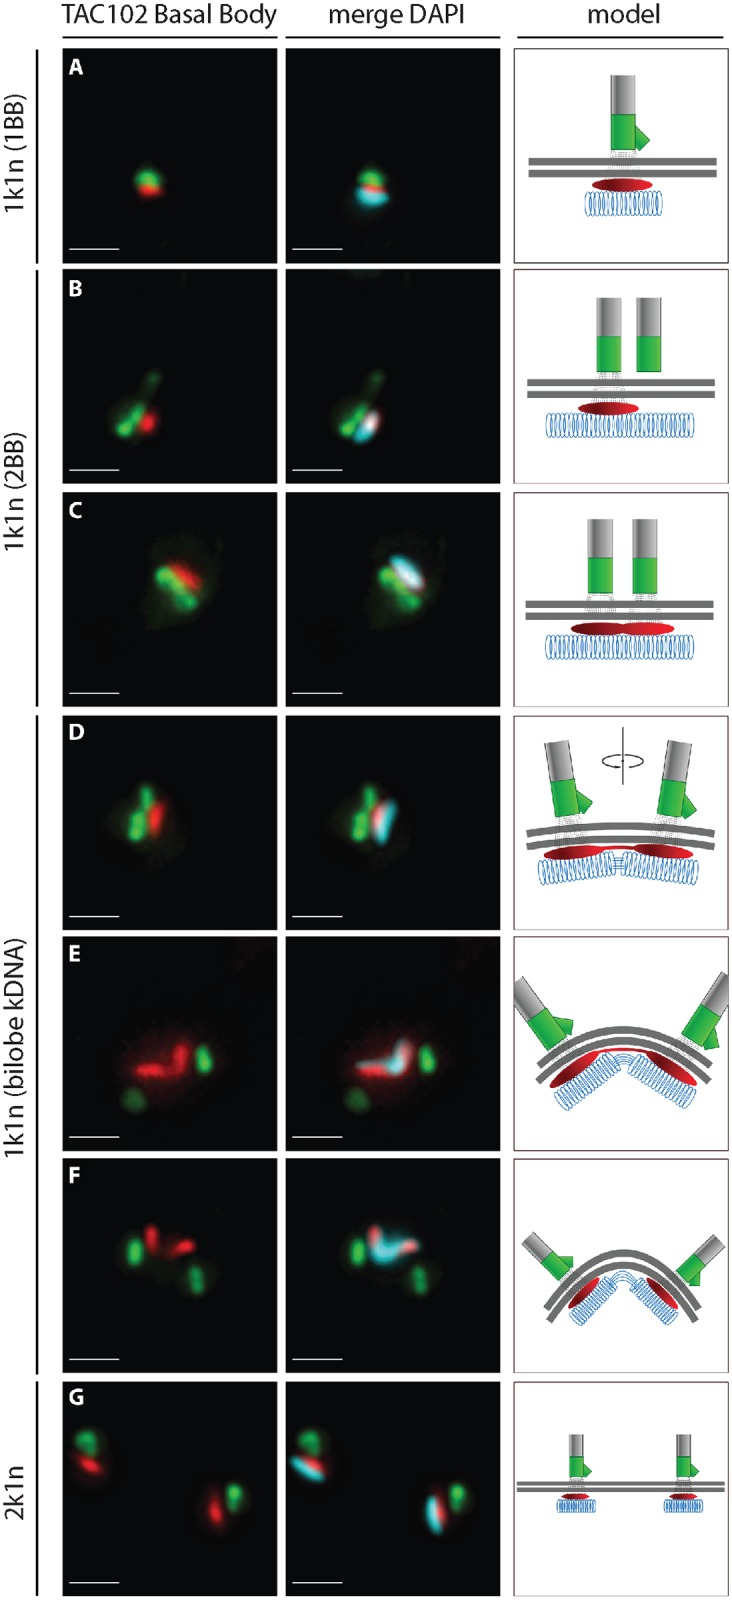
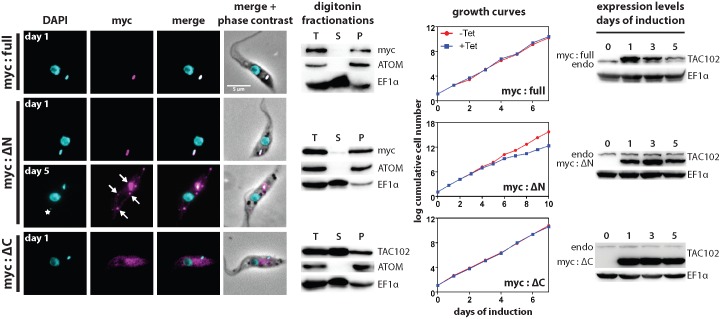
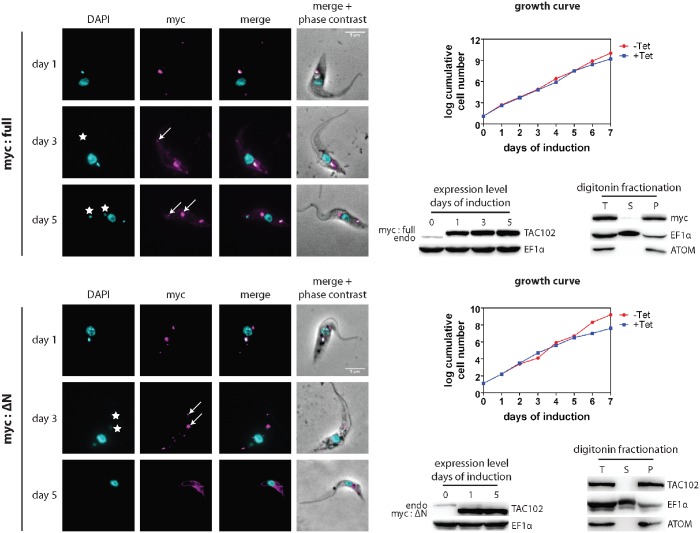
Trypanosomes show an intriguing organization of their mitochondrial DNA into a catenated network, the kinetoplast DNA (kDNA). While more than 30 proteins involved in kDNA replication have been described, only few components of kDNA segregation machinery are currently known. Electron microscopy studies identified a high-order structure, the tripartite attachment complex (TAC), linking the basal body of the flagellum via the mitochondrial membranes to the kDNA. Here we describe TAC102, a novel core component of the TAC, which is essential for proper kDNA segregation during cell division. Loss of TAC102 leads to mitochondrial genome missegregation but has no impact on proper organelle biogenesis and segregation. The protein is present throughout the cell cycle and is assembled into the newly developing TAC only after the pro-basal body has matured indicating a hierarchy in the assembly process. Furthermore, we provide evidence that the TAC is replicated de novo rather than using a semi-conservative mechanism. Lastly, we demonstrate that TAC102 lacks an N-terminal mitochondrial targeting sequence and requires sequences in the C-terminal part of the protein for its proper localization.


Conflict of interest statement

The authors have declared that no competing interests exist.

Figures

Fig 1
Fig 1. RNAi against TAC102 in BSF cells causes missegregation and loss of kDNA.
A–growth curve of cells uninduced (−Tet) and induced (+Tet) for TAC102 RNAi. Inset: northern blot probed for TAC102 and 18S rRNA (loading control). RNA was isolated from cells that were uninduced (−) or induced for two days (+). The western blot under the growth curve demonstrates downregulation of TAC102 protein upon induction of RNAi, α-tubulin was used as a loading control. B–immunofluorescence images showing missegregation and loss of kDNA as well as the unchanged mitochondrial morphology upon induction of RNAi against TAC102. DNA is stained with DAPI (cyan). Mitochondria are visualized by staining for the mitochondrial heat-shock protein 70 (mtHSP70, red). Scale bar 5 μm. C–percentage of cells with different k-n-combinations within the course of TAC102 RNAi. D–intensity of the kDNA signal measured by DAPI staining. E–the relative amount of minicircle DNA decreases within the course of TAC102 RNAi, according to Southern blotting, α-tubulin was used for normalization and the amount of minicircle DNA in non-induced cells (day 0) was taken as 100%. A representative Southern blot is shown on the right side of the graph.
Fig 2
Fig 2. Ultrastructure of kDNA upon RNAi against TAC102 in BSF cells revealed by transmission electron microscopy.
bb, basal body; mm, mitochondrial membrane; edm, electron dense material; −Tet, non-induced cells; +Tet, cells with TAC102 RNAi induced for two days. A,B–kDNA in a non-induced cells. C,D–examples of enlarged kDNA in cells induced for TAC102 RNAi for two days. The arrows point at additional patches of kDNA. E–example of a cell induced for TAC102 RNAi for two days that has lost the kDNA, instead only a small patch of electron dense material (edm) can be seen surrounded by the mitochondrial membrane (mm) and localized in the proximity to the basal body (bb). F–an example of a cell induced for TAC102 RNAi for two days that has lost the kDNA and does not have any detectable electron dense material (edm); however, the mitochondrial membrane (mm) and the basal body (bb) are seen well. G–quantification of the kDNA diameter, measured as shown in A (white bar), in non-induced and induced cells.
Fig 3
Fig 3. RNAi against TAC102 in BSF cells (γL262P) affects kDNA segregation but not cell growth.
A–growth curve of cells uninduced (–Tet) and induced (+Tet) for TAC102 RNAi. Inset: northern blot probed for TAC102 and 18S rRNA (loading control). RNA was isolated from cells that were uninduced (−) or induced for two days (+). B–epifluorescence images (DAPI staining) of cells upon induction of RNAi against TAC102 for two days. Scale bar 5 μm. C–percentage of cells with different k-n-combinations within the course of TAC102 RNAi.
Fig 4
Fig 4. Localization of TAC102 in BSF and PCF T. brucei.
A–STED microscopy image showing localization of N-PTP-TAC102 within the mitochondrion of a BSF cell. The mitochondria are stained with MitoTracker (gray, first image). The N-PTP-TAC102 is visualized by anti-Protein A antibody (gray, second image). In the Overlay/Zoom, the mitochondrion is shown in red and TAC102 –in green. Scale bar 2 μm. B–immunofluorescence microscopy images showing the localization of N-PTP-TAC102 between the kDNA and the basal body of the flagellum in a BSF cell. DNA is stained with DAPI (cyan). The N-PTP-TAC102 is visualized by anti-Protein A antibody (red) and the basal body (YL1/2) is shown in green. The outline of the cell is shown with a white dashed line. Scale bar 2 μm, inset is a 200% zoom. C–western blot of a digitonin fractionation of BSF cells expressing N-PTP-TAC102. ATOM, a mitochondrial protein, and ALBA3, a cytosolic protein, are used as controls of the fractionation. D–immunofluorescence microscopy images showing the localization of TAC102 between the kDNA and the basal body of the flagellum in a PCF cell. DNA is stained with DAPI (cyan). TAC102 is visualized by anti-TAC102 antibody (red) and the basal body is visualized by YL1/2 antibody (green). Scale bar 5 μm. E–western blots of digitonin fractionations from PCF cells. Fractionations were performed with different concentrations of the detergent. total, total cell lysate; sup, supernatant. LipDH, lipid dehydrogenase, a mitochondrial matrix protein; ATOM, archaic translocase of the outer mitochondrial membrane; COXIV, cytochrome oxidase subunit 4, an inner mitochondrial membrane protein.
Fig 5
Fig 5. TAC102 remains associated with the flagellum after flagellar extraction of BSF cells.
Immunofluorescence analysis was performed with flagella isolated from BSF cells that express N-PTP-TAC102. The flagella are stained with PFR antibody (yellow). The structure at the end of the flagellum (in a white square box) is enlarged to show the kDNA (stained with DAPI) in cyan, the basal body (visualized with BBA4 antibody)–in green and N-PTP-TAC102 (detected by anti-Protein A antibody)–in red. Scale bar 1 μm.
Fig 6
Fig 6. Localization of TAC102 in BSF T. brucei during different stages of kDNA replication.
Immunofluorescence images show the localization of N-PTP-TAC102 (detected by anti-Protein A antibody, red), the basal body (YL1/2, green) and the kDNA (stained with DAPI, cyan). A schematic model corresponding to each situation is shown on the right side of the images. Panels AG represent different stages during kDNA replication. Scale bar 1 μm.
Fig 7
Fig 7. Analysis of truncated versions of TAC102 upon their overexpression.
The full-length (myc:full), N-terminally (myc:ΔN) or C-terminally (myc:ΔC) truncated TAC102 was expressed with a triple myc-tag at the N-terminus in PCF cells. Immunofluorescence images show the localization of the tagged proteins. DNA is stained with DAPI (cyan) and myc-tagged proteins (visualized by anti-myc antibody) are shown in magenta. The star (myc:ΔN, day 5) indicates an ancillary kinetoplast and the arrows indicate accumulation of the protein. Scale bar 5 μm. For each of the three cell lines, western blots of digitonin fractionations are shown. ATOM and EF1α are used as fractionation controls. T, total cell lysate; S, supernatant; P, pellet. Fractionations were performed on day 1 post induction. The growth curves show cell growth upon expression of the tagged proteins. The western blots on the right side of the growth curves show expression levels of the tagged versions of TAC102 in comparison to those of the endogenous protein (endo). EF1α is used as a loading control.
Fig 8
Fig 8. The myc:full version of TAC102 is able to partially compensate for the loss of the endogenous TAC102 but the myc:ΔN is not.
The full-length (myc:full) or the N-terminally truncated (myc:ΔN) version of TAC102 was expressed with a triple myc-tag at the N-terminus in PCF cells that contain a construct for inducible RNAi against the 3’-UTR of the endogenous TAC102. Immunofluorescence images show the localization of the tagged proteins. DNA is stained with DAPI (cyan) and myc-tagged proteins (visualized by anti-myc antibody) are shown in magenta. Arrows show additional foci of TAC102 accumulation. Stars show ancillary kDNAs. Scale bar 5 μm. For each of the two cell lines, growth curves of the cells upon expression of the tagged proteins/knockdown of the endogenous TAC102 are shown on the right side of the immunofluorescence images. Under the growth curves (left side) are western blots that show expression levels of the tagged versions of TAC102 in comparison to those of the endogenous protein (endo). EF1α is used as loading control. Under the growth curves (right side) are western blots of digitonin fractionations. ATOM (a mitochondrial protein) and EF1α (a cytosolic protein) are used as fractionation controls. T, total cell lysate; S, supernatant; P, pellet. Fractionations were performed on day 5 of induction.
Fig 9
Fig 9. Ectopic expression of GFP-301aa fusion protein in PCF cells at early time points of induction.
GFP-301aa is a chimeric protein where the last 301 aa of TAC102 are fused to the C-terminus of GFP. Expression of GFP-301aa was induced for 1, 2, 3 or 4 hours. Immunofluorescence images show the localization of GFP-301aa (visualized by anti-GFP antibody, green). The mitochondrial heat-shock protein 70 (mtHSP70) is used as a mitochondrial marker (red). DNA is stained with DAPI (cyan). Scale bar 5 μm.

Comment in

Similar articles

Cited by

References

    1. Jensen RE, Englund PT. Network news: the replication of kinetoplast DNA. Annu Rev Microbiol. 2012;66: 473–491. 10.1146/annurev-micro-092611-150057 - DOI - PubMed
    1. Povelones ML. Beyond replication: division and segregation of mitochondrial DNA in kinetoplastids. Mol Biochem Parasitol. 2014;196: 53–60. 10.1016/j.molbiopara.2014.03.008 - DOI - PubMed
    1. Hajduk S, Ochsenreiter T. RNA editing in kinetoplastids. RNA Biol. 2010;7: 229–236. - PubMed
    1. Aphasizhev R, Aphasizheva I. Uridine insertion/deletion editing in trypanosomes: a playground for RNA-guided information transfer. Wiley Interdiscip Rev RNA. 2011;2: 669–685. 10.1002/wrna.82 - DOI - PMC - PubMed
    1. Stuart KD, Schnaufer A, Ernst NL, Panigrahi AK. Complex management: RNA editing in trypanosomes. Trends Biochem Sci. 2005;30: 97–105. - PubMed

Publication types

MeSH terms