. 2015 Jun;2(3):120-136.
doi: 10.1002/reg2.37. Epub 2015 Jun 19.

Gene expression during the first 28 days of axolotl limb regeneration I: Experimental design and global analysis of gene expression

Affiliations

Gene expression during the first 28 days of axolotl limb regeneration I: Experimental design and global analysis of gene expression

S Randal Voss et al. Regeneration (Oxf). 2015 Jun.

Abstract

While it is appreciated that global gene expression analyses can provide novel insights about complex biological processes, experiments are generally insufficiently powered to achieve this goal. Here we report the results of a robust microarray experiment of axolotl forelimb regeneration. At each of 20 post-amputation time points, we estimated gene expression for 10 replicate RNA samples that were isolated from 1 mm of heterogeneous tissue collected from the distal limb tip. We show that the limb transcription program diverges progressively with time from the non-injured state, and divergence among time adjacent samples is mostly gradual. However, punctuated episodes of transcription were identified for five intervals of time, with four of these coinciding with well-described stages of limb regeneration-amputation, early bud, late bud, and pallet. The results suggest that regeneration is highly temporally structured and regulated by mechanisms that function within narrow windows of time to coordinate transcription within and across cell types of the regenerating limb. Our results provide an integrative framework for hypothesis generation using this complex and highly informative data set.

Keywords: Axolotl; limb; microarray; regeneration; transcription.


Figures

Figure 1
Figure 1
Experimental design compared to published studies that have examined gene expression during axolotl limb regeneration. The stages of limb regeneration are amputation (A), pre‐bud (PB), early bud (EB), medium bud (MB), late bud (LB), palette (P), digital outgrowth (DO), and completed (C). The vertical dashed lines show the stages that were examined and the red horizontal line shows the plane of amputation for an upper arm transection. The asterisks indicate when samples were collected for each experiment.
Figure 2
Figure 2
(A) How individuals were classified into developmental stages during the experiment. All individuals were classified as pre‐bud before day 10. (B) The length of the forelimb as measured distally from the initial plane of amputation. The error bars are standard deviations of the mean.
Figure 3
Figure 3
Sample gene expression profiles that can be accessed via Sal‐Site. Each estimate of transcript abundance was calculated from 10 replicate samples. The error bars are standard deviations.
Figure 4
Figure 4
The number of probesets identified as significantly different on comparing post‐amputation samples to the day 0 sample. Bars show probesets with increasing (black bars) and decreasing (grey bars) changes in abundance.
Figure 5
Figure 5
The number of times that each of the significant probesets was identified as significant when contrasting post‐amputation samples with the day 0 sample. For example, the probeset that corresponds to fibronectin yielded seven significant results out of a possible 19 contrasts (day 0 vs. day 0.5, day 0 vs. day 1, …, day 0 vs. day 28). In comparison, the probeset of tenascin C showed a significant deviation from day 0 early in the time series and thus yielded 18 significant results.
Figure 6
Figure 6
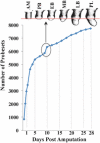
Cumulative frequency distribution showing when each of the probesets identified as significantly differently expressed when contrasting post‐amputation time points to day 0 were first identified as significant. The dashed circle shows a discontinuity in the profile between days 9 and 10 which corresponds to the onset of the early bud (EB) stage of regeneration.
Figure 7
Figure 7
(A) Number of significant probesets identified between time adjacent samples using a P value threshold of 0.01 to evaluate the significance of independent t tests. Bars show probesets with increasing (black bars) and decreasing (grey bars) changes in abundance relative to the previous sample. The red asterisks show where the number of significant probesets increased significantly between time adjacent contrasts. For example, the number of significant probesets identified for the 2−3 DPA contrast was significantly higher than the number identified for the 1.5−2 DPA contrast. The blue asterisk at day 0.5 highlights the large number of significant probesets that were identified between the non‐amputated state and the first post‐amputation sample. (B) Number of significant probesets identified between time adjacent samples using a P value threshold of 0.001 to evaluate the significance of independent t tests. Note that punctuated episodes of transcription are observed at a more conservative statistical threshold. All other components of the figure follow the descriptions above.
Figure 8
Figure 8
Hierarchical cluster analysis reveals temporal grouping of samples, with the first bifurcation splitting samples into early (days 0−9) and late (days 10−28) groups. The numbers positioned at nodes in the dendogram are approximately unbiased bootstrap values. The y‐axis is 1 − Pearson's correlation coefficient and the x‐axis shows the samples according to the day of collection. For example, 0, day 0; and 0.5, day 0.5. The colors refer to regeneration stages: pre‐bud (PB), early bud (EB), medium bud (MB), late bud (LB), and pallet (P).
Figure 9
Figure 9
Expression profiles for genes identified as differently expressed at 0−0.5 DPA (A−H) and 2−3 DPA (I−P). Each estimate of transcript abundance was calculated from 10 replicate samples. The error bars are standard deviations.
Figure 10
Figure 10
Expression profiles for genes identified as differently expressed at 9−10 DPA (A−H). Additional genes that are associated with FGF signaling (I, J), chondrogenesis (K, L), and osteoclast activity (M, N) showed expression profile transitions at 9−10 DPA. Each estimate of transcript abundance was calculated from 10 replicate samples. The error bars are standard deviations.
Figure 11
Figure 11
(A) Expression profiles of muscle‐associated genes showing correlated changes in average transcript abundance and standard deviation. (B) The expression estimates for the eight muscle genes in (A) were used to calculate an among genes average for each tissue sample that was collected at 7, 9, 10, and 12 DPA. The replicates are ordered within figures to show the distribution of estimates from low to high. The error bars are standard deviations.
Figure 12
Figure 12
Expression profiles for genes identified as differently expressed at 18−20 DPA (A−H) and 22−24 DPA (I−P). Each estimate of transcript abundance was calculated from 10 replicate samples. The error bars are standard deviations.

References

    1. Athippozhy, A. , Lehrberg, J. , Monaghan, J. R. , Gardiner, D.M. & Voss, S.R. (2014). Characterization of in vitro transcriptional responses of dorsal root ganglia cultured in the presence and absence of blastema cells from regenerating salamander limbs. Regeneration, 1, 1–10. - PMC - PubMed
    1. Benjamini, Y. & Hochberg, Y. (1995). Journal of the Royal Statistical Society, Series B (Methodological), 57, 289–300.
    1. Campbell, L.J. , Suarez‐Castillo, E.C. , Ortiz‐Zuazaga, H. , Knapp, D. , Tanaka, E.M. & Crews, C.M. (2011). Gene expression profile of the regeneration epithelium during axolotl limb regeneration. Dev Dyn, 7, 1826–1840. - PMC - PubMed
    1. Carlson, B.M. (2007). Principles of Regenerative Biology. Academic; Press. Burlington, MA.
    1. Dennis, G. Jr , Sherman, B.T. , Hosack, D.A. , Yang, J. , Gao, W. , Lane, H.C. et al. (2003). DAVID: Database for annotation, visualization, and integrated discovery. Genom Biol, 4, P3. - PubMed