

Increased colonic propionate reduces anticipatory reward responses in the human striatum to high-energy foods
- PMID: 27169834
- PMCID: PMC4919527
- DOI: 10.3945/ajcn.115.126706
Increased colonic propionate reduces anticipatory reward responses in the human striatum to high-energy foods
Abstract
Background: Short-chain fatty acids (SCFAs), metabolites produced through the microbial fermentation of nondigestible dietary components, have key roles in energy homeostasis. Animal research suggests that colon-derived SCFAs modulate feeding behavior via central mechanisms. In humans, increased colonic production of the SCFA propionate acutely reduces energy intake. However, evidence of an effect of colonic propionate on the human brain or reward-based eating behavior is currently unavailable.
Objectives: We investigated the effect of increased colonic propionate production on brain anticipatory reward responses during food picture evaluation. We hypothesized that elevated colonic propionate would reduce both reward responses and ad libitum energy intake via stimulation of anorexigenic gut hormone secretion.
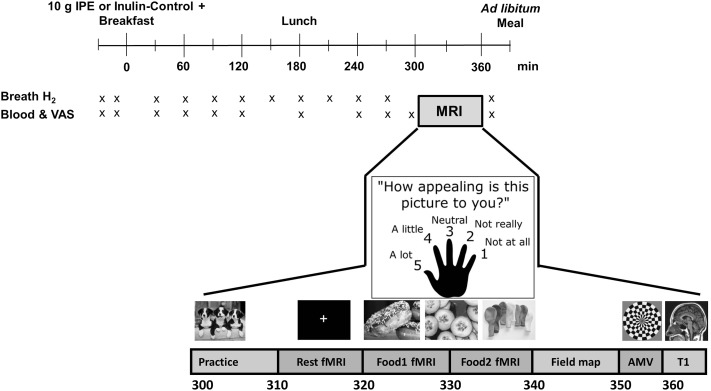
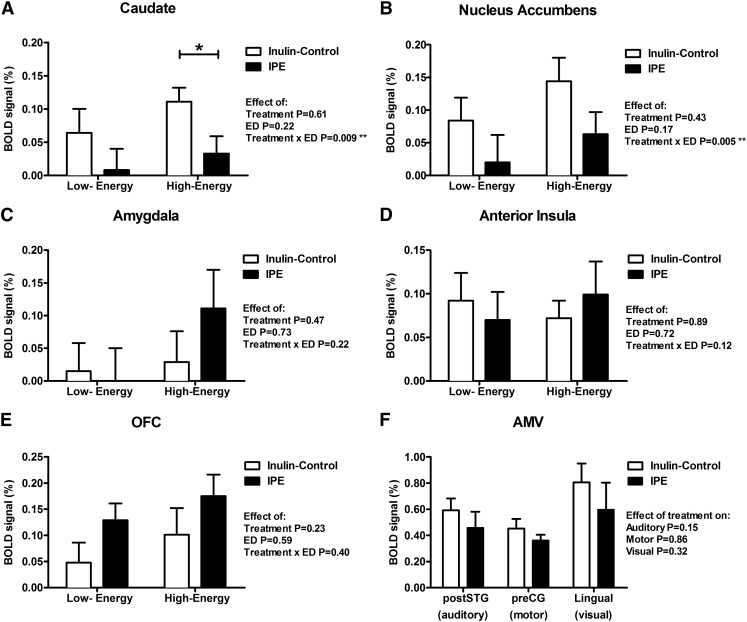
Design: In a randomized crossover design, 20 healthy nonobese men completed a functional magnetic resonance imaging (fMRI) food picture evaluation task after consumption of control inulin or inulin-propionate ester, a unique dietary compound that selectively augments colonic propionate production. The blood oxygen level-dependent (BOLD) signal was measured in a priori brain regions involved in reward processing, including the caudate, nucleus accumbens, amygdala, anterior insula, and orbitofrontal cortex (n = 18 had analyzable fMRI data).
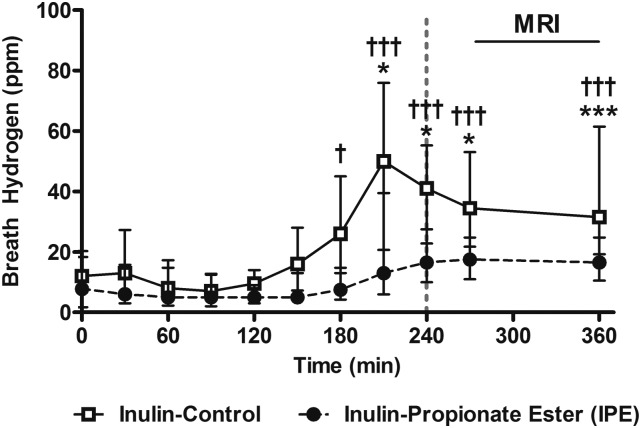
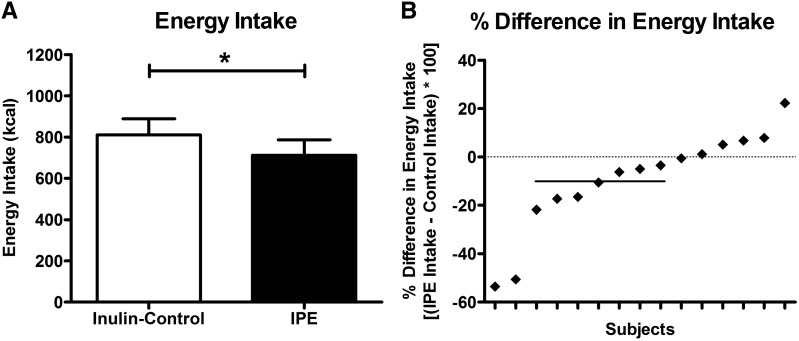
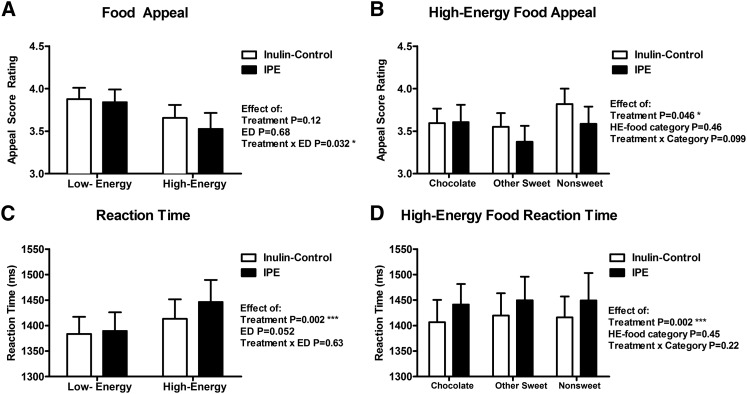
Results: Increasing colonic propionate production reduced BOLD signal during food picture evaluation in the caudate and nucleus accumbens. In the caudate, the reduction in BOLD signal was driven specifically by a lowering of the response to high-energy food. These central effects were partnered with a decrease in subjective appeal of high-energy food pictures and reduced energy intake during an ad libitum meal. These observations were not related to changes in blood peptide YY (PYY), glucagon-like peptide 1 (GLP-1), glucose, or insulin concentrations.
Conclusion: Our results suggest that colonic propionate production may play an important role in attenuating reward-based eating behavior via striatal pathways, independent of changes in plasma PYY and GLP-1. This trial was registered at clinicaltrials.gov as NCT00750438.
Keywords: appetite; fMRI; propionate; reward; striatum.
Figures
Similar articles
-
Effects of targeted delivery of propionate to the human colon on appetite regulation, body weight maintenance and adiposity in overweight adults.Gut. 2015 Nov;64(11):1744-54. doi: 10.1136/gutjnl-2014-307913. Epub 2014 Dec 10. Gut. 2015. PMID: 25500202 Free PMC article. Clinical Trial.
-
L-rhamnose as a source of colonic propionate inhibits insulin secretion but does not influence measures of appetite or food intake.Appetite. 2016 Mar 1;98:142-9. doi: 10.1016/j.appet.2015.12.011. Epub 2015 Dec 17. Appetite. 2016. PMID: 26706043 Clinical Trial.
-
Addition of Rye Bran and Pea Fiber to Pork Meatballs Enhances Subjective Satiety in Healthy Men, but Does Not Change Glycemic or Hormonal Responses: A Randomized Crossover Meal Test Study.J Nutr. 2017 Sep;147(9):1700-1708. doi: 10.3945/jn.117.250332. Epub 2017 Aug 9. J Nutr. 2017. PMID: 28794212 Clinical Trial.
-
Control of appetite and energy intake by SCFA: what are the potential underlying mechanisms?Proc Nutr Soc. 2015 Aug;74(3):328-36. doi: 10.1017/S0029665114001657. Epub 2014 Dec 12. Proc Nutr Soc. 2015. PMID: 25497601 Review.
-
Effects of exercise intensity on plasma concentrations of appetite-regulating hormones: Potential mechanisms.Appetite. 2016 Mar 1;98:80-8. doi: 10.1016/j.appet.2015.12.016. Epub 2015 Dec 22. Appetite. 2016. PMID: 26721721 Review.
Cited by
-
Soluble Fiber with High Water-Binding Capacity, Swelling Capacity, and Fermentability Reduces Food Intake by Promoting Satiety Rather Than Satiation in Rats.Nutrients. 2016 Oct 2;8(10):615. doi: 10.3390/nu8100615. Nutrients. 2016. PMID: 27706095 Free PMC article.
-
Gut Microbiota Metabolites in Major Depressive Disorder-Deep Insights into Their Pathophysiological Role and Potential Translational Applications.Metabolites. 2022 Jan 8;12(1):50. doi: 10.3390/metabo12010050. Metabolites. 2022. PMID: 35050172 Free PMC article. Review.
-
Short chain fatty acids enriched fermentation metabolites of soluble dietary fibre from Musa paradisiaca drives HT29 colon cancer cells to apoptosis.PLoS One. 2019 May 16;14(5):e0216604. doi: 10.1371/journal.pone.0216604. eCollection 2019. PLoS One. 2019. PMID: 31095579 Free PMC article.
-
The Western Diet-Microbiome-Host Interaction and Its Role in Metabolic Disease.Nutrients. 2018 Mar 17;10(3):365. doi: 10.3390/nu10030365. Nutrients. 2018. PMID: 29562591 Free PMC article. Review.
-
Effects of Inulin Propionate Ester Incorporated into Palatable Food Products on Appetite and Resting Energy Expenditure: A Randomised Crossover Study.Nutrients. 2019 Apr 16;11(4):861. doi: 10.3390/nu11040861. Nutrients. 2019. PMID: 30995824 Free PMC article. Clinical Trial.
References
-
- Murphy KG, Bloom SR. Gut hormones and the regulation of energy homeostasis. Nature 2006;444:854–9. - PubMed
-
- Dagher A. Functional brain imaging of appetite. Trends Endocrinol Metab 2012;23:250–60. - PubMed
-
- Goldstone AP, Prechtl de Hernandez CG, Beaver JD, Muhammed K, Croese C, Bell G, Durighel G, Hughes E, Waldman AD, Frost G. Fasting biases brain reward systems towards high‐calorie foods. Eur J Neurosci 2009;30:1625–35. - PubMed
Publication types
MeSH terms
Substances
Associated data
Grants and funding
LinkOut - more resources
Full Text Sources
Other Literature Sources
Medical
