

Does neighborhood fast-food outlet exposure amplify inequalities in diet and obesity? A cross-sectional study
- PMID: 27169835
- PMCID: PMC4880999
- DOI: 10.3945/ajcn.115.128132
Does neighborhood fast-food outlet exposure amplify inequalities in diet and obesity? A cross-sectional study
Abstract
Background: Greater exposures to fast-food outlets and lower levels of education are independently associated with less healthy diets and obesity. Little is known about the interplay between these environmental and individual factors.
Objective: The purpose of this study was to test whether observed differences in fast-food consumption and obesity by fast-food outlet exposure are moderated by educational attainment.
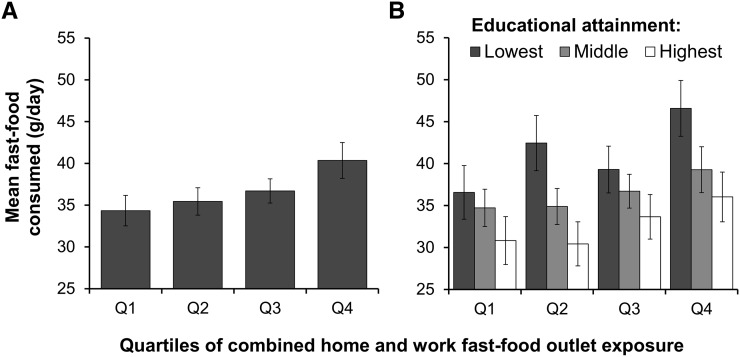
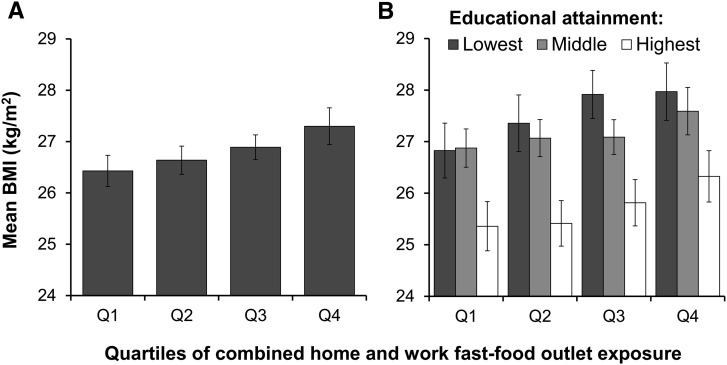
Design: In a population-based cohort of 5958 adults aged 29-62 y in Cambridgeshire, United Kingdom, we used educational attainment-stratified regression models to estimate the food-frequency questionnaire-derived consumption of energy-dense "fast foods" (g/d) typically sold in fast-food restaurants and measured body mass index (BMI; in kg/m(2)) across geographic information system-derived home and work fast-food exposure quartiles. We used logistic regression to estimate the odds of obesity (BMI ≥30) and calculated relative excess risk due to interaction (RERI) on an additive scale. Participant data were collected during 2005-2013 and analyzed in 2015.
Results: Greater fast-food consumption, BMI, and odds of obesity were associated with greater fast-food outlet exposure and a lower educational level. Fast-food consumption and BMI were significantly different across education groups at all levels of fast-food outlet exposure (P < 0.05). High fast-food outlet exposure amplified differences in fast-food consumption across levels of education. The relation between fast-food outlet exposure and obesity was only significant among those who were least educated (OR: 2.05; 95% CI: 1.08, 3.87; RERI = 0.88), which suggested a positive additive interaction between education and fast-food outlet exposure.
Conclusion: These findings suggest that efforts to improve diets and health through neighborhood-level fast-food outlet regulation might be effective across socioeconomic groups and may serve to reduce observed socioeconomic inequalities in diet and obesity.
Keywords: deprivation amplification; educational attainment; fast-food; geographic information systems; obesity.
Figures
References
-
- McPherson K, Marsh K, Brown M. Foresight: tackling obesities: future choices—modelling future trends in obesity and the impact on health. Government Office for Science; 2007. Available from: https://www.gov.uk/government/uploads/system/uploads/attachment_data/fil....
-
- The Strategy Unit Cabinet Office. Food: an analysis of the issues. January 2008 [cited 2012 Feb 29]. Available from: http://tinyurl.com/nbjb52q.
-
- Lachat C, Nago E, Verstraeten R, Roberfroid D, Van Camp J, Kolsteren P. Eating out of home and its association with dietary intake: a systematic review of the evidence. Obes Rev 2012;13:329–46. - PubMed
-
- Drewnowski A, Specter SE. Poverty and obesity: the role of energy density and energy costs. Am J Clin Nutr 2004;79:6–16. - PubMed
Publication types
MeSH terms
Grants and funding
LinkOut - more resources
Full Text Sources
Other Literature Sources
Medical
