. 2016 May 11;36(19):5299-313.
doi: 10.1523/JNEUROSCI.2649-15.2016.

Actin Tyrosine-53-Phosphorylation in Neuronal Maturation and Synaptic Plasticity

Affiliations

Actin Tyrosine-53-Phosphorylation in Neuronal Maturation and Synaptic Plasticity

Enni Bertling et al. J Neurosci. .

Abstract

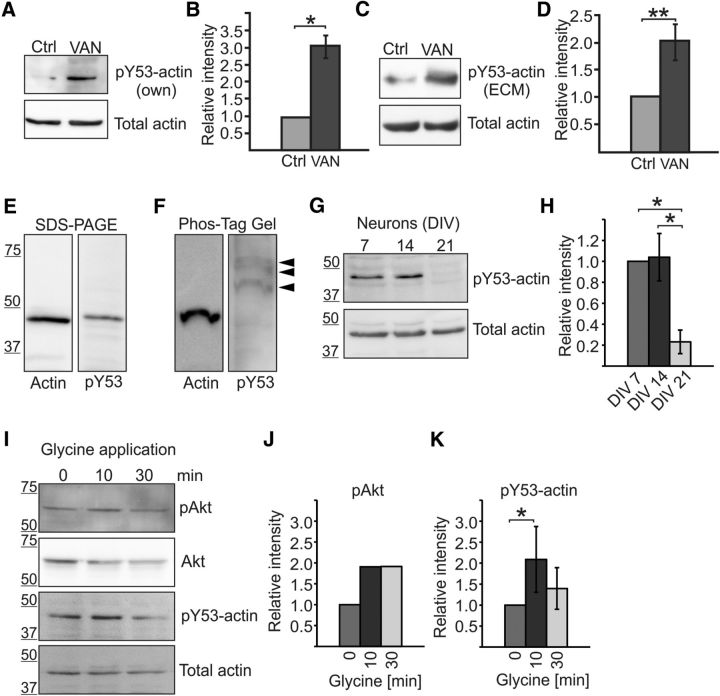
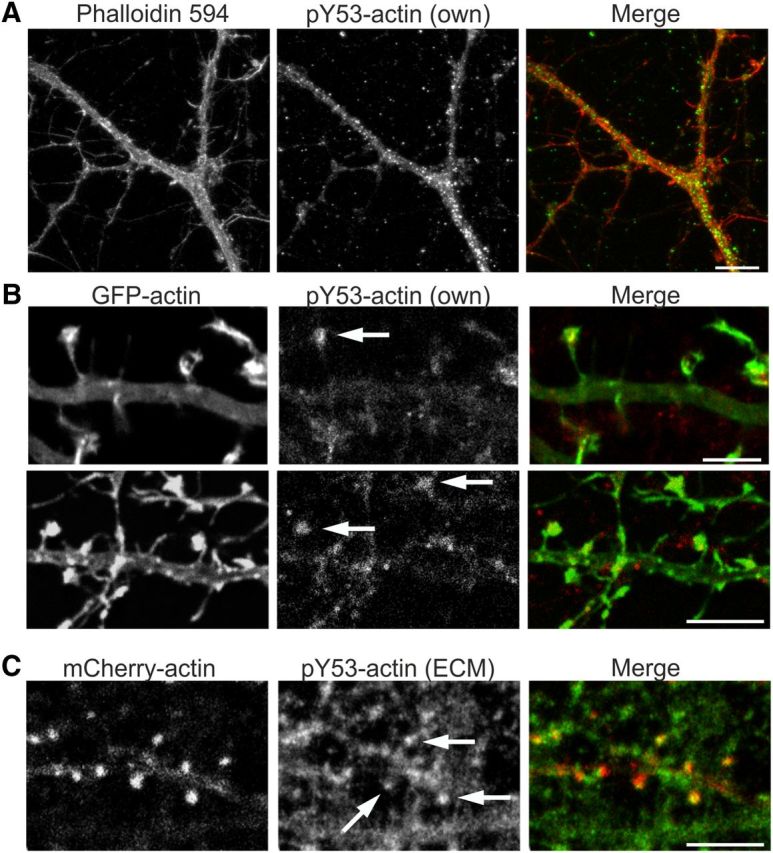
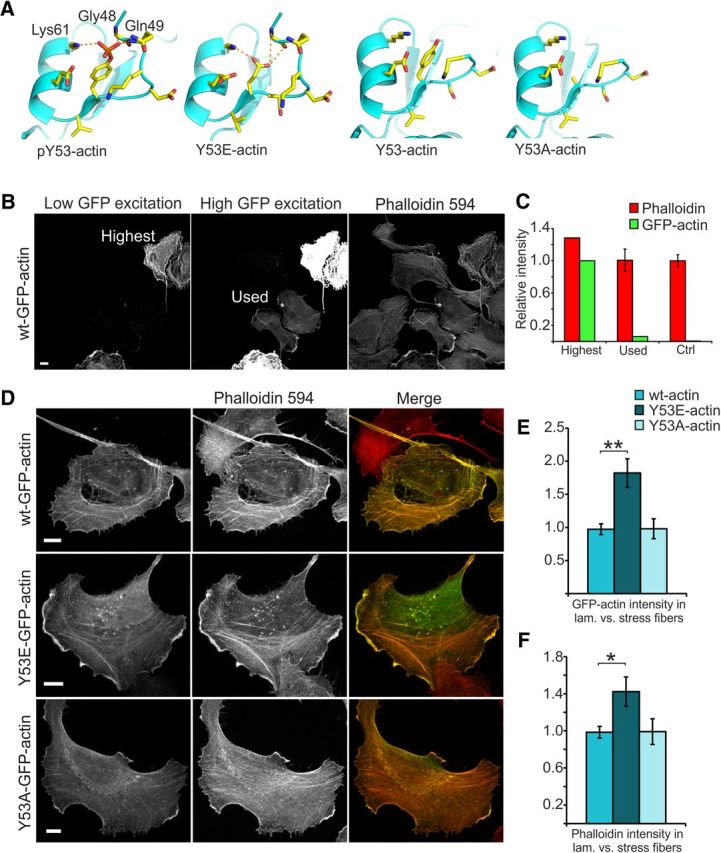
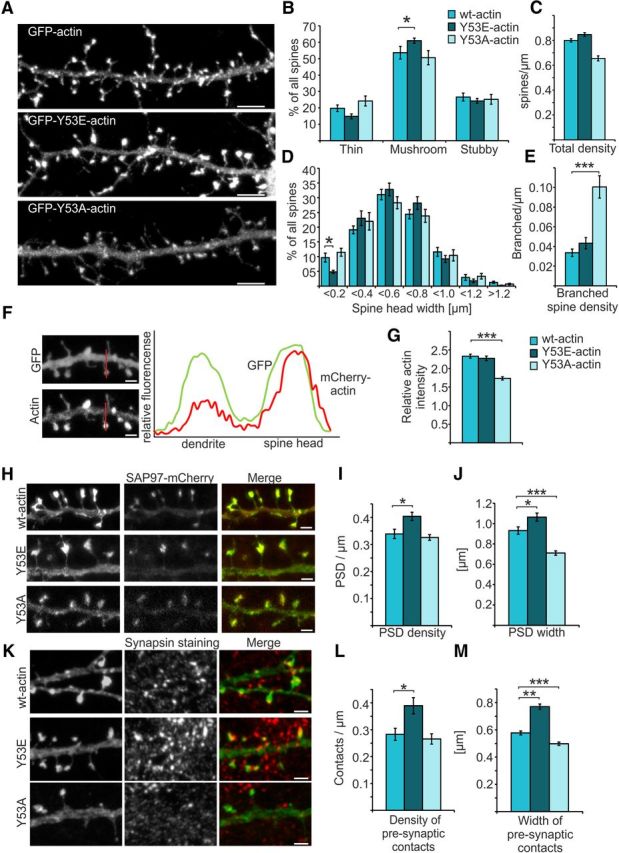
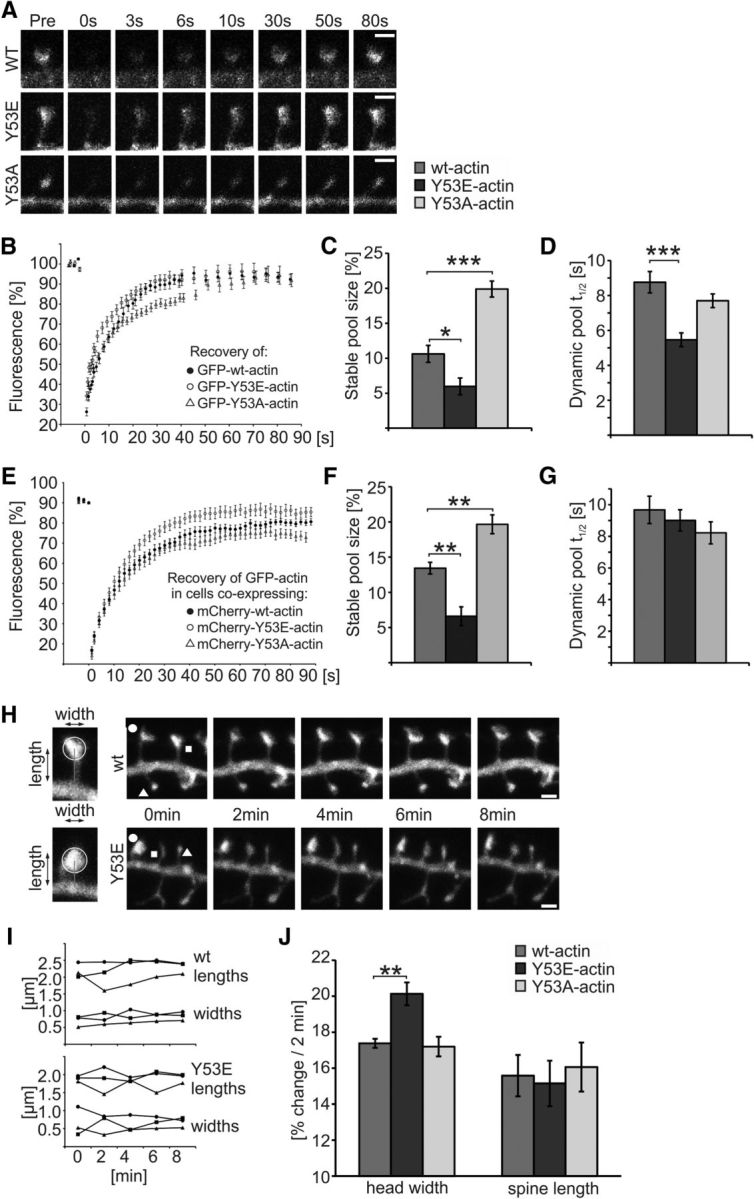
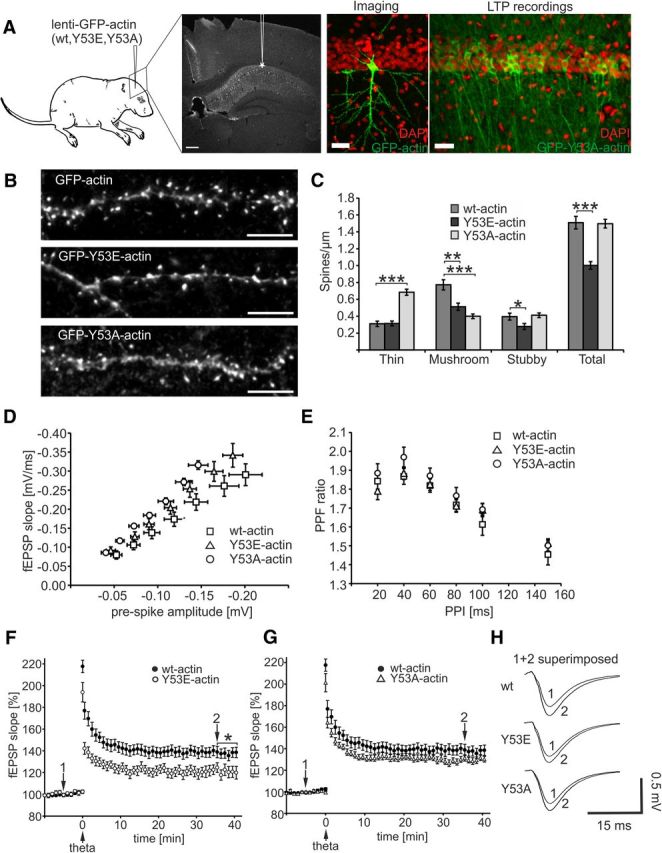
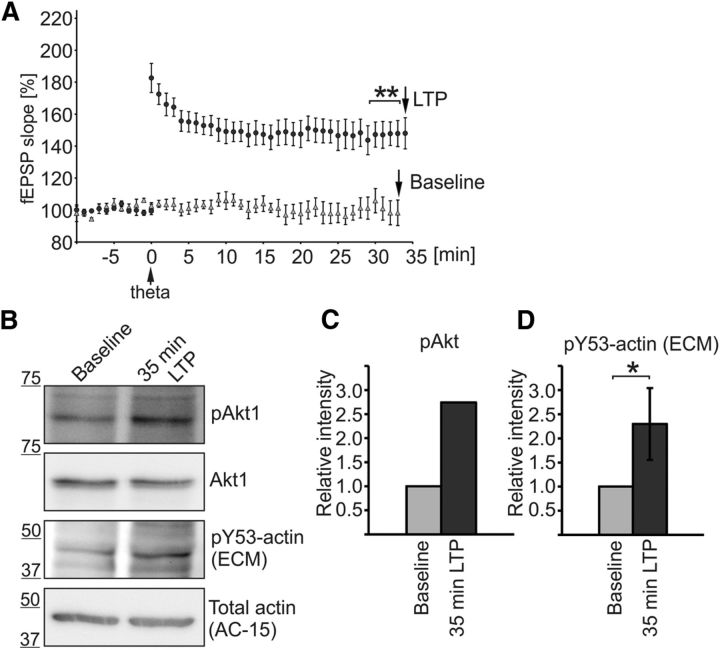
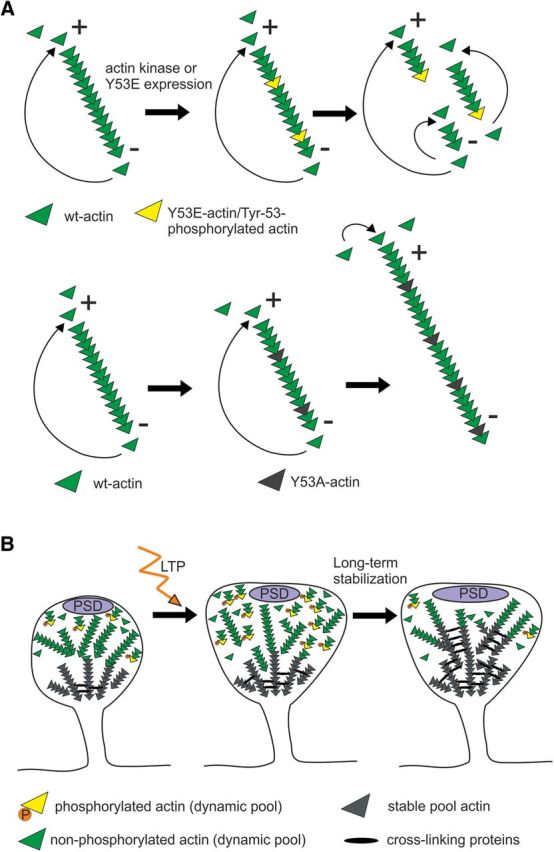
Rapid reorganization and stabilization of the actin cytoskeleton in dendritic spines enables cellular processes underlying learning, such as long-term potentiation (LTP). Dendritic spines are enriched in exceptionally short and dynamic actin filaments, but the studies so far have not revealed the molecular mechanisms underlying the high actin dynamics in dendritic spines. Here, we show that actin in dendritic spines is dynamically phosphorylated at tyrosine-53 (Y53) in rat hippocampal and cortical neurons. Our findings show that actin phosphorylation increases the turnover rate of actin filaments and promotes the short-term dynamics of dendritic spines. During neuronal maturation, actin phosphorylation peaks at the first weeks of morphogenesis, when dendritic spines form, and the amount of Y53-phosphorylated actin decreases when spines mature and stabilize. Induction of LTP transiently increases the amount of phosphorylated actin and LTP induction is deficient in neurons expressing mutant actin that mimics phosphorylation. Actin phosphorylation provides a molecular mechanism to maintain the high actin dynamics in dendritic spines during neuronal development and to induce fast reorganization of the actin cytoskeleton in synaptic plasticity. In turn, dephosphorylation of actin is required for the stabilization of actin filaments that is necessary for proper dendritic spine maturation and LTP maintenance.

Significance statement: Dendritic spines are small protrusions from neuronal dendrites where the postsynaptic components of most excitatory synapses reside. Precise control of dendritic spine morphology and density is critical for normal brain function. Accordingly, aberrant spine morphology is linked to many neurological diseases. The actin cytoskeleton is a structural element underlying the proper morphology of dendritic spines. Therefore, defects in the regulation of the actin cytoskeleton in neurons have been implicated in neurological diseases. Here, we revealed a novel mechanism for regulating neuronal actin cytoskeleton that explains the specific organization and dynamics of actin in spines. The better we understand the regulation of the dendritic spine morphology, the better we understand what goes wrong in neurological diseases.

Keywords: LTP; actin cytoskeleton; dendritic spines; phosphorylation; spinogenesis; synaptic plasticity.


Figures

Figure 1.
Figure 1.
Amount of actin Y53 phosphorylation changes during neuronal maturation and upon glycine application in cortical neurons. A, Western blot using pY53-actin-specific antibody shows that actin is phosphorylated in hippocampal neurons and the level of phosphorylation increases with Na3VO4 treatment. The total amount of actin was controlled using AC-15 actin antibody. VAN, 15 min 1 mm Na3VO4 treatment. B, Quantification of blots in A shown as the ratio of pY53-actin/total actin normalized to control. Graph represents four independent experiments. The amount of recognized phosphorylated actin was increased 3.0-fold by phosphatase inhibition. *p < 0.05, nonparametric Kruskal–Wallis test. C, Similar experiment as in A, but pY53-actin was detected using commercial pY53-actin antibody (ECM, ECM Biosciences) and cortical neuron cultures were used. D, Quantification of blots in C shown as the ratio of pY53-actin/total actin normalized to control. Graph represents five independent experiments. The amount of recognized phosphorylated actin was increased 2.0-fold by phosphatase inhibition. **p < 0.01, nonparametric Kruskal–Wallis test. E, F, Actin and pY53-actin migrated at similar speeds in normal SDS-PAGE gels (E), but phosphorylated actin migrated more slowly in Phos-tag gel (F). Commercial pY53-actin antibody (ECM Biosciences) detected three different bands in Phos-tag gel but no bands the size of nonphosphorylated actin. Data represent three independent experiments. G, Cortical neurons were cultured for 7, 14, and 21 DIV and lysates were run on SDS-PAGE and blotted against pY53-actin (ECM Biosciences) or total actin (AC-15). H, Quantification of G revealing that Y53 phosphorylation decreases by DIV21 (relative phosphorylation amounts: DIV7 = 1.0, DIV14 = 1.0, DIV21 = 0.2). Graph represents three analyzed blots (two different antibodies) from two independent experiments. *p < 0.05, nonparametric Kruskal–Wallis test. I, Freshly diluted 200 μm glycine in HBS was applied to DIV14 cortical cultures for 3 min after a 10 min incubation with blockers TTX, strychnine, and picrotoxin. Cells were then washed using HBS and lysed after a 10- or 30 min incubation in HBS. Samples were blotted against pAkt, Akt, pY53-actin (ECM), and total actin. J, pAkt levels were increased 1.9-fold 10 and 30 min after glycine application. K, The amount of pY53-actin was increased 2.1-fold 10 min after glycine application, but the increase in phosphorylation diminished after 30 min (1.4-fold increase compared with preinduction). Graph represents four independent experiments. *p < 0.05, nonparametric Kruskal–Wallis test. Data are represented as mean ± SEM.
Figure 2.
Figure 2.
Actin Y53 phosphorylation is a strictly localized phenomenon. A, Immunofluorescence staining of primary DIV10 hippocampal low-density culture using anti-pY53-actin specific antibody. Y53-phosphorylated actin is located throughout dendrites and filopodial protrusions in a punctate manner. Scale bar, 15 μm. B, Immunofluorescence staining of primary DIV14 hippocampal neurons using pY53-actin specific antibody shows the localization of pY53-actin to dendritic spine heads. Cells are transfected with GFP-actin to highlight a single dendrite. Images from one confocal layer (z = 0.450 μm) are shown. Arrows indicate staining in spine heads. Scale bars, 5 μm. C, Immunofluorescence staining of mCherry-actin-transfected primary DIV14 hippocampal neurons using pY53-actin antibody (ECM Biosciences). Images from one confocal layer (z = 0.450 μm) are shown. Antibody staining shows clear localization in spine heads (arrows). Scale bars, 5 μm. Data in AC represent five independent experiments.
Figure 3.
Figure 3.
Low levels of Y53E-actin expression enhance the development of lamellipodia and hinder the establishment of stress fibers. A, Actin structures visualizing Y53 and adjacent amino acids. Generated mutations (Y53E and Y53A) visualized by modeled structures. Y53 phosphorylation results in the formation of hydrogen bonds with amino acids Gly48, Gln49, and Lys61, stabilizing the D-loop. Y53E mutation generates a negative charge mimicking the phosphorylated form of actin. Putative hydrogen bonds are indicated in the image. In the nonphosphorylated form and the Y53A mutation, the D-loop is flexible and thus not seen in the structure. Images were generated using the program PyMOL (http://pymol.sourceforge.net/) starting from the structures PDB 3CI5 (pY53-actin) and PDB 3CI5 (nonphosphorylated actin; Baek et al., 2008). B, Images taken of U2OS cells with high and low laser powers reveal different levels in GFP-actin expression and how GFP-actin expression levels affect phalloidin staining intensity. Scale bar, 10 μm. C, When the GFP intensity in the high-expressing cell shown in B is set to 100%, ImageJ intensity analysis reveals that the low-expressing cells used in these experiments express only 6% of this maximum expression level. The intensity of phalloidin staining in these low-expressing cells is the same as in nontransfected controls. D, F-actin staining (phalloidin-594) of U2OS cells expressing GFP-(wt/Y53E/ Y53A)-actin. Scale bars, 10 μm. E, GFP-actin constructs are distributed differently between lamellipodial actin and stress fibers: wt ratio = 1.0 (similar intensity in lamellipodium and in stress fibers); Y53E ratio = 1.8; Y53A ratio = 1.0. Data in E and F represent n(wt) = 17, n(Y53E) = 14, n(Y53A) = 11 cells pooled from two independent experiments. **p < 0.01 one-way ANOVA with Bonferroni's post hoc test. F, Overexpression of GFP-Y53E-actin causes a shift toward lamellipodial actin: wt ratio = 1.0 (similar intensity in lamellipodium and in stress fibers), Y53E ratio = 1.4, Y53A ratio = 1.0. *p < 0.05 one-way ANOVA with Bonferroni's post hoc test. Data are represented as mean ± SEM.
Figure 4.
Figure 4.
Expression of mutant actin mimicking pY53-actin increases the proportion of mushroom-shaped dendritic spines. A, GFP-actin-, GFP-Y53E-actin-, and GFP-Y53A-actin-expressing primary hippocampal neurons at DIV14. Scale bars, 5 μm. B, C, Quantification of spine morphology from neurons cotransfected with mCherry-actins and free GFP revealed an increased proportion of mushroom spines in mCherry-Y53E-actin expressing neurons. Proportions of thin, mushroom, and stubby spine morphologies: wt: 20% thin, 54% mushroom, 27% stubby, total density = 0.80 spines/μm; Y53E: 15% thin, 61% mushroom, 24% stubby, total density = 0.83 spines/μm; Y53A: 24% thin, 51% mushroom, 25% stubby, total density = 0.66 spines/μm. Data in BE represent n(wt) = 15 cells, 986 spines, 1342 μm of dendrite; n(Y53E) = 19 cells, 1522 spines, 1998 μm of dendrite; n(Y53A) = 15 cells, 1119 spines, 1587 μm of dendrite pooled from four independent experiments.*p < 0.05 one-way ANOVA with Bonferroni's post hoc test. D, Size distribution of spines analyzed in B and C. Spines are grouped with 0.2 μm intervals. Spines with small heads (<0.2 μm) were significantly reduced in Y53E-actin-expressing neurons. E, GFP-Y53A-actin induces branching of spine heads. Branched spine densities: wt = 0.03, Y53E = 0.04; Y53A = 0.10 spines/μm. ***p < 0.001 one-way ANOVA with Bonferroni's post hoc test. F, Free GFP and mCherry-actin expressed in a primary hippocampal neuron. Expression plot profile was generated from the line shown in the picture. Distribution of actin between spine and dendrite was measured and normalized to GFP signal. Scale bars, 1 μm. G, mCherry-Y53A-actin showed a reduced concentration in spine heads compared with wt- and mCherry-Y53E-actin. Head versus dendrite localizations: wt = 2.3, Y53E = 2.3, Y53A = 1.7. Data represent n = 10 cells, 100 spines for each actin construct pooled from two independent experiments. ***p < 0.001 one-way ANOVA with Bonferroni's post hoc test. H, PSD densities and sizes of PSDs of GFP-(wt/Y53E/Y53A)-actin expressing cells were analyzed based on PSD labeling by SAP97-mCherry. Scale bars, 1 μm. I, Quantification shows that PSD density was significantly increased in cells expressing GFP-Y53E-actin. Density of PSDs: wt = 0.34 PSD/μm, n = 17 cells, 1707 μm of dendrite; Y53E = 0.40 PSD/μm, n = 14 cells, 1394 μm of dendrite; Y53A = 0.33 PSD/μm, n = 14 cells, 1227 μm of dendrite. Data are pooled from two independent experiments. *p < 0.05 one-way ANOVA with Bonferroni's post hoc test. J, Quantification of PSD widths shows that PSD sizes were significantly increased in cells expressing GFP-Y53E-actin together with SAP97-mCherry, whereas, in cells expressing GFP-Y53A-actin, PSD accumulations were significantly smaller. PSD width: wt = 0.9 μm, n = 10 cells, 270 spines with PSD; Y53E = 1.1 μm, n = 10 cells, 235 spines with PSD; Y53A = 0.7 μm, n = 10 cells, 341 spines with PSD. Data are pooled from two independent experiments. *p < 0.05, ***p < 0.001, one-way ANOVA with Bonferroni's post hoc test. K, Presynaptic site densities and widths of synapsin staining next to GFP-(wt/Y53E/Y53A)-actin expressing spines. Scale bars, 1 μm. L, Quantification shows that presynaptic site density was significantly increased in cells expressing GFP-Y53E-actin. Densities: wt = 0.28 presynaptic contacts/μm, n = 14 cells, 1070 μm of dendrite; Y53E = 0.39, n = 12 cells, 835 μm of dendrite; Y53A = 0.27, n = 13 cells, 1031 μm of dendrite. Data are pooled from three independent experiments. *p < 0.05 one-way ANOVA with Bonferroni's post hoc test. M, Quantification of the width of presynaptic contacts shows that widths were significantly increased in cells expressing GFP-Y53E-actin, whereas, in cells expressing GFP-Y53A-actin, synapsin accumulations were significantly reduced. wt = 0.58 μm, n = 6 cells, 241 pre synaptic sites; Y53E = 0.77 μm, n = 4 cells, 269 presynaptic sites; Y53A = 0.50 μm, n = 8 cells, 252 presynaptic sites. Data are pooled from two independent experiments. **p < 0.01, ***p < 0.001, one-way ANOVA with Bonferroni's post hoc test. Data are represented as mean ± SEM.
Figure 5.
Figure 5.
Expression of mutant actin mimicking pY53-actin increases the turnover rate of actin filaments and spine head dynamics. A, Example images presenting fluorescence recovery of GFP-(wt/Y53E/Y53A)-actin in dendritic spines of primary DIV14 hippocampal neurons. B, Analyses of FRAP assays show the mean GFP-actin fluorescence recovery curves of GFP-(wt/Y53E/Y53A)-actin. C, Stable pool sizes measured from the mean FRAP curves of individual cells show that GFP-Y53E-actin has a smaller, whereas GFP-Y53A-actin has a larger, stable-F-actin pool fraction. Stable pool size: wt = 11%, Y53E = 6%, Y53A = 20%. *p < 0.05, ***p < 0.001, one-way ANOVA with Bonferroni's post hoc test. D, GFP-Y53E-actin recovery half-time is significantly shorter, whereas GFP-Y53A-actin shows no significant change compared with GFP-wt-actin. Recovery half-time of dynamic pool: wt: 8.8 s; Y53E: 5.5 s; Y53A: 7.7 s. Data in C and D represent n(wt) = 14 cells, 51 spines, n(Y53E) = 14 cells, 50 spines, n(Y53A) = 14 cells, 55 spines pooled from three independent experiments. ***p < 0.001, one-way ANOVA with Bonferroni's post hoc test. E, Analyses of FRAP assays show the mean GFP-actin fluorescence recovery curves in dendritic spines of primary DIV14 hippocampal neurons coexpressing mCherry-tagged wt-, Y53E-, or Y53A-actin. F, Stable pool sizes measured from the mean FRAP curves of individual cells show that GFP-actin in spines coexpressing mCherry-Y53E-actin have a smaller stable-F-actin pool fraction, whereas spines coexpressing mCherry-Y53A-actin have a larger stable-F-actin pool fraction. Stable pool size: wt = 13%, Y53E = 7%, Y53A = 20%. **p < 0.01 one-way ANOVA with Bonferroni's post hoc test. G, GFP-actin recovery half-time of dynamic F-actin pool is not significantly different in cells expressing mCherry-(wt/Y53E/Y53A)-actin together with GFP-actin. Recovery half-time of dynamic pool: wt: 9.7 s; Y53E: 9.0 s; Y53A: 8.2 s. Data in F and G represent n(wt) = 15 cells, 58 spines, n(Y53E) = 14 cells, 56 spines, n(Y53A) = 15 cells, 59 spines pooled from four independent experiments. H, Representative images used in spine length and width analyses. Images of GFP fluorescence taken at 2 min intervals. Scale bars, 1 μm. I, Analysis of spine motility by measuring the mean head width and spine length fluctuation at 2 min intervals. Symbols indicating the time points refer to the spines marked with corresponding symbols in H. J, Fluctuation percentages were averaged to give a motility index for cells expressing mCherry-(wt/Y53E/Y53A)-actin together with GFP. The magnitude of spine head movement was larger in cells expressing Y53E-actin compared with wt-actin (wt: 17%, n = 6 cells, 340 spines; Y53E: 20%, n = 5 cells, 375 spines; Y53A: 17%, n = 6 cells, 420 spines). No significant change in spine length fluctuation was observed (wt: 16%, Y53E: 15%, Y53A: 16%). Data are pooled from three independent experiments. **p < 0.01 one-way ANOVA with Bonferroni's post hoc test. Data are represented as mean ± SEM.
Figure 6.
Figure 6.
Expression of Y53E-actin in rat hippocampus decreases dendritic spine density and attenuates LTP formation. A, Lentiviral transduction was performed at P1–P4 in rat hippocampi. Higher-magnification confocal images of the CA1 area show transduction efficiency used for imaging and for LTP recordings. DAPI nuclear staining is shown in red, GFP-actin fluorescence in green. Transduction efficiency in slices used for LTP recording is ∼35%. Scale bars, 10 μm. B, Dendrites of CA1 pyramidal hippocampal neurons at P15–P19 expressing GFP-tagged wt-, Y53E-, or Y53A-actin. Similar to wt, GFP-Y53E-actin localizes to spines, whereas GFP-Y53A-actin shows shaft localization. Scale bars, 5 μm. C, Quantification of spine morphology reveals that the total spine number is diminished in neurons expressing GFP-Y53E-actin. Expression of GFP-Y53A-actin shifts spine type distribution to thin spines without altering the total spine density: wt: thin = 0.31, mushroom = 0.77, stubby = 0.40, total = 1.51 spines/μm; n = 11 cells, 1235 spines, 821 μm dendrite, pooled from 3 rats; Y53E: thin = 0.31, mushroom = 0.51, stubby = 0.28, total = 1.00 spines/μm; n = 10 cells, 795 spines, 746 μm dendrite, pooled from 3 rats; Y53A: thin = 0.68, mushroom = 0.40, stubby = 0.41, total = 1.50 spines/μm; n = 10 cells, 964 spines, 637 μm dendrite, pooled from 3 rats. **p < 0.01, ***p < 0.001, one-way ANOVA with Bonferroni's post hoc test. D, I/O ratios did not differ between slices expressing different actin constructs. The number of recordings from slices expressing wt-, Y53E-, and Y53A-actin constructs were 13 (13 rats), 13 (10 rats), and 17 (12 rats), respectively. E, No significant differences in the PPF were found between the wt-, Y53E-, and Y53A-actin construct groups [n(wt) = 12 (12 rats), n(Y53E) = 14 (13 rats), and n(Y53A) = 14 (12 rats)]. F, G, Pooled data from recordings of fEPSPs in the CA1 of hippocampal slices expressing wt-actin (F, G), Y53E-actin (F),and Y53A-GFP-actin (G). A stimulation interval of 20 s was used and every third response is shown in the graph. TFS was applied at 0 min. At 35–40 min, the fEPSP was potentiated 37 ± 4% [n = 18 slices (13 rats)] in wt-actin-expressing slices, 22 ± 4% [n = 11 (8 rats)] in Y53E-actin-expressing slices, and 30 ± 2% [n = 21 (12 rats)] in Y53A-actin-expressing slices. *p < 0.05, Kruskal–Wallis test with Dunn–Bonferroni post hoc method. H, Superimposed average fEPSP responses at −5 min (1) and 35 min (2) for all groups. Data are represented as mean ± SEM.
Figure 7.
Figure 7.
Phosphorylation level of endogenous actin increases during LTP formation in acute hippocampal slices. A, LTP was induced in rat hippocampal slices similar to the experiment presented in Figure 6 (circles). The CA1s of the slices were frozen in liquid nitrogen 35 min after LTP induction. In addition to slices with LTP induction, we collected Western blot samples from control slices recorded without LTP induction (triangles). At 32 min, the fEPSP was potentiated 55 ± 2% [n = 8 slices (8 rats)] in LTP-induced slices and 4 ± 2% [n = 5 (5 rats)] in slices without LTP induction, p = 0.003. **p < 0.01, nonparametric Kruskal–Wallis test. B, The success of LTP induction was further controlled by measuring the known LTP-responsive Akt Ser473 phosphorylation (Racaniello et al., 2010) and pY53-actin levels were detected with pY53-actin antibodies (ECM Biosciences). C, pAkt levels were increased 2.7-fold 35 min after LTP induction. D, Western blotting against pY53-actin revealed that actin phosphorylation was increased 2.3-fold in LTP-induced slices compared with control samples. Graph represents five independent experiments. *p < 0.05, nonparametric Wilcoxon signed-rank test. Data are represented as mean ± SEM.
Figure 8.
Figure 8.
Model figure illustrating the function of mutant actin constructs and the role of Y53 phosphorylation during dendritic spine maturation and LTP formation. A, Working model for the effects of the Y53E- and Y53A-actin expression on actin filament turnover. In a cellular context, there is a net addition of monomers at the plus end and net dissociation at the pointed end, leading to filament elongation occurring mainly at the plus end. The constant incorporation and dissociation of monomers at filament ends results in a “treadmilling” effect. Y53E-actin creates points with weaker actin–actin binding along the filament. When filaments break at these points, the filaments become shorter and the increase in numbers of both plus and minus ends enhances the turnover rate. Y53A-actin creates higher affinity binding with adjacent actin monomers, thus slowing down the depolymerization rate at minus ends. This “pointed end capping” increases filament length. B, During spine morphogenesis, actin filaments are maintained highly dynamic by Y53 phosphorylation (spine on left). High-frequency synapse activation induces reorganization, polymerization, and stabilization of actin filaments. We propose that actin phosphorylation serves as a mechanism to break actin filaments into shorter filaments to facilitate the reorganization of the actin cytoskeleton (spine in the middle). In turn, dephosphorylation is required for the stabilization of actin filaments during LTP maintenance or during dendritic spine maturation (spine on right).

References

    1. Anderson WW, Collingridge GL. Capabilities of the WinLTP data acquisition program extending beyond basic LTP experimental functions. J Neurosci Methods. 2007;162:346–356. doi: 10.1016/j.jneumeth.2006.12.018. - DOI - PubMed
    1. Baba T, Fusaki N, Shinya N, Iwamatsu A, Hozumi N. Actin tyrosine dephosphorylation by the Src homology 1-containing protein tyrosine phosphatase is essential for actin depolymerization after membrane IgM cross-linking. J Immunol. 2003;170:3762–3768. doi: 10.4049/jimmunol.170.7.3762. - DOI - PubMed
    1. Baek K, Liu X, Ferron F, Shu S, Korn ED, Dominguez R. Modulation of actin structure and function by phosphorylation of Tyr-53 and profilin binding. Proc Natl Acad Sci U S A. 2008;105:11748–11753. doi: 10.1073/pnas.0805852105. - DOI - PMC - PubMed
    1. Bellot A, Guivernau B, Tajes M, Bosch-Morató M, Valls-Comamala V, Muñoz FJ. The structure and function of actin cytoskeleton in mature glutamatergic dendritic spines. Brain Res. 2014;1573:1–16. doi: 10.1016/j.brainres.2014.05.024. - DOI - PubMed
    1. Bertling E, Ludwig A, Koskinen M, Hotulainen P. Methods for three-dimensional analysis of dendritic spine dynamics. Methods Enzymol. 2012;506:391–406. doi: 10.1016/B978-0-12-391856-7.00043-3. - DOI - PubMed

Publication types

Associated data

LinkOut - more resources