. 2016 May 11;36(19):5314-27.
doi: 10.1523/JNEUROSCI.4333-15.2016.

Selectivity of Neuromodulatory Projections from the Basal Forebrain and Locus Ceruleus to Primary Sensory Cortices

Affiliations

Selectivity of Neuromodulatory Projections from the Basal Forebrain and Locus Ceruleus to Primary Sensory Cortices

Jae-Hyun Kim et al. J Neurosci. .

Abstract

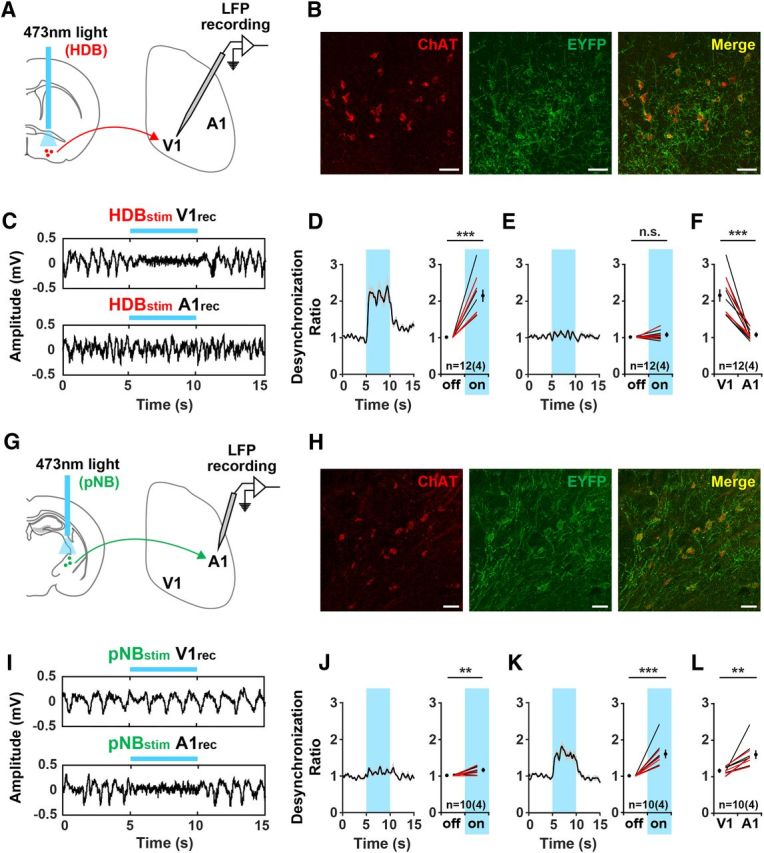
Acetylcholine and noradrenaline are major neuromodulators that affect sensory processing in the cortex. Modality-specific sensory information is processed in defined areas of the cortex, but it is unclear whether cholinergic neurons in the basal forebrain (BF) and noradrenergic neurons in the locus ceruleus (LC) project to and modulate these areas in a sensory modality-selective manner. Here, we mapped BF and LC projections to different sensory cortices of the mouse using dual retrograde tracing. We found that while the innervation of cholinergic neurons into sensory cortices is predominantly modality specific, the projections of noradrenergic neurons diverge onto multiple sensory cortices. Consistent with this anatomy, optogenetic activation of cholinergic neurons in BF subnuclei induces modality-selective desynchronization in specific sensory cortices, whereas activation of noradrenergic LC neurons induces broad desynchronization throughout multiple sensory cortices. Thus, we demonstrate a clear distinction in the organization and function of cholinergic BF and noradrenergic LC projections into primary sensory cortices: cholinergic BF neurons are highly selective in their projections and modulation of specific sensory cortices, whereas noradrenergic LC neurons broadly innervate and modulate multiple sensory cortices.

Significance statement: Neuromodulatory inputs from the basal forebrain (BF) and locus ceruleus (LC) are widespread in the mammalian cerebral cortex and are known to play important roles in attention and arousal, but little is known about the selectivity of their cortical projections. Using a dual retrobead tracing technique along with optogenetic stimulation, we have identified anatomic and functional differences in the way cholinergic BF neurons and noradrenergic LC neurons project into primary sensory cortices. While BF projections are highly selective to individual sensory cortices, LC projections diverge into multiple sensory cortices. To our knowledge, this is the first definitive proof that BF and LC projections to primary sensory cortices show both anatomic and functional differences in selectivity for modulating cortical activity.

Keywords: basal forebrain; cholinergic; locus ceruleus; neuromodulation; noradrenergic; sensory cortex.


Figures

Figure 1.
Figure 1.
Dual retrograde tracing of sensory cortices. A, Schematic of the retrobead injections. V1–A1, V1–S1, and A1–S1 indicate the primary sensory cortices into which each of the three groups of samples received green and red retrobead injections. B, Traced and imaged regions of the BF and LC. Bottom, Representative coronal sections within the regions serially sectioned. The vertical lines indicate the boundaries of the imaged areas and the black squares indicate the area analyzed within each section. C, Traced thalamic regions from each sensory cortex. Left, Fluorescence images of the ventral posteromedial nucleus (VPM), medial geniculate nucleus (MGN), and lateral geniculate nucleus (LGN) showing labeled neurons traced from S1, A1, and V1, respectively. Scale bars, 200 μm. Center, Schematic illustrating the relevant thalamocortical connections. Arrows indicate axonal projections. Dotted lines indicate coronal sections at the injection sites. Right, Fluorescence images of the S1, A1, and V1 injection sites. Scale bars, 500 μm. White lines indicate the boundaries of thalamic nuclei and the injection sites. The numbers indicate the position of sections relative to the bregma (in millimeters).
Figure 2.
Figure 2.
Cholinergic BF neurons show selective projections to the sensory cortex. A, Schematic of brain sections including the HDB, aNB, and pNB BF areas (anterior to posterior). Black squares indicate the imaged BF areas. B, Fluorescence images of ChAT+ BF neurons labeled with green and red retrobeads in the three injection groups (V1–A1, V1–S1, A1–S1). Top, Labeled cells in the HDB; middle, aNB; bottom, pNB; red, red retrobeads; green, green retrobeads; blue, ChAT; scale bars, 50 μm. C, Top, Topographic localization of retrobead-labeled ChAT+ cells along the anterior-to-posterior BF in the three groups (V1–A1, n = 7; V1–S1, n = 5; A1–S1, n = 6; n represents the number of animals). Bars indicate the number of retrobead-labeled cholinergic (ChAT+) neurons (mean ± SEM). Red, green, and blue bars indicate neurons projecting to V1, A1, and S1, respectively. Black bars indicate neurons labeled with both green and red retrobeads, meaning they project to two different sensory cortices. The horizontal lines below the graphs indicate the anterior-to-posterior extent of the HDB, aNB, pNB, in the BF. Bottom, Same as the top, but for noncholinergic (ChAT−) neurons. D, E, Combined distribution of retrobead-labeled ChAT+ (D) and ChAT− (E) neurons in the BF. Data from the three different groups in A–C are combined based on the target sensory cortices. Bars indicate the number of cells labeled with a single type of retrobead (mean ± SEM). Dotted lines indicate the total number of retrobead-labeled neurons.
Figure 3.
Figure 3.
Noradrenergic LC neurons show diverging projection to multiple sensory cortices. A, Schematic of the LC in the brainstem. The black square indicates the imaged area, which includes the LC. B, Representative images of the LC from each of the three injection groups (V1–A1, V1–S1, A1–S1). Dotted lines indicate the LC boundary as defined by TH immunostaining. Red, Red retrobeads; green, green retrobeads. Scale bars, 50 μm. C, Left, Representative image of TH and DAPI staining in the LC from the V1–A1 injection group (green, A1; red, V1). Scale bar, 50 μm. Right, Enlarged view of the area inside the white square in the left image. Blue, DAPI; magenta, TH; scale bar, 10 μm. D, Representative images of the six types of retrobead-labeled LC neurons. The images in the third row indicate the cell in the right white box from C. The color of DAPI was changed from blue to cyan to minimize confusion. Scale bars, 10 μm. E, Top, Topographic localization of retrobead-labeled TH+ cells along the anterior-to-posterior LC in the three groups (V1–A1, n = 6; V1–S1, n = 5; A1–S1, n = 6; n represents the number of animals). Bars indicate the number of noradrenergic (TH+) retrobead-labeled neurons (mean ± SEM). Red, green, and blue bars indicate neurons projecting to V1, A1, and S1, respectively. Black bars indicate neurons labeled with both green and red retrobeads. Bottom, Same as the top, but for TH− cells. F, G, Combined distribution of retrobead-labeled TH+ (F) and TH− (G) neurons in the LC. Data from the three different groups in A–C are combined based on their target sensory cortices. Bars indicate the number of cells labeled with a single type of retrobead (mean ± SEM). Dotted lines indicate the total number of retrobead-labeled neurons.
Figure 4.
Figure 4.
ML and DV localization of cholinergic BF and noradrenergic LC neurons projecting to sensory cortices. A, Top, Schematic of representative coronal sections within the HDB. The topographic distribution of cholinergic neurons within the black square was analyzed along the ML and DV axes. Bottom, ML–DV scatter plot (3 × 3 mm) of the individual neurons overlaid with bar graphs (mean ± SEM) indicating the number of retrobead-labeled neurons in each coronal section. Red, green, and blue circles and bars indicate neurons traced from V1, A1, and S1, respectively (i.e., unimodal projection neurons). Black circles and bars indicate neurons colabeled with both green and red retrobeads (i.e., bimodal projection neurons). Bin size for bar graphs, 0.2 mm. B, Same as A, but for aNB. C, Same as A, but for pNB. D, Same as A, but for noradrenergic LC neurons. Bin size for bar graphs, 0.067 mm.
Figure 5.
Figure 5.
Selectivity of the BF and LC inputs to sensory cortices. A, Number of ChAT+ and ChAT− BF cells projecting into V1 (n = 12), A1 (n = 13), and S1 (n = 11). B, Same as A, but for TH+ and TH− LC cells (V1, n = 11; A1, n = 12; S1, n = 11). Bars, mean ± SEM. C, ChAT+ and TH+ neurons as a percentage of the total retrobead-labeled neurons in the BF (n = 36) and LC (n = 34), respectively. Note that there are no significant differences between the percentage of ChAT+ BF and TH+ LC neurons (n.s., not significant; unpaired t test). D, Selective projections of cholinergic BF neurons to the primary sensory cortices. Numbers of ChAT+ (top) and ChAT− (bottom) neurons in the three experimental groups (V1–A1, V1–S1, A1–S1). Red, green, and blue bars indicate neurons showing modality-selective projections to V1, A1, and S1, respectively (Uni; mean ± SEM). Black bars indicate neurons colabeled with both green and red retrobeads, meaning they send their axons into two sensory cortices (Bi; mean ± SEM). Uni indicates unimodel projections. Bi indicates bimodal projections. V1, n = 24; A1, n = 26; S1, n = 22. ***p < 0.001; **p < 0.01; *p < 0.5 (paired t test). E, Divergent projections of LC neurons into the primary sensory cortices; same as D, but for TH+ (top) and TH− (bottom) LC neurons (V1, n = 22; A1, n = 24; S1, n = 22). Bars, mean ± SEM. F, Unimodal and bimodal projecting neurons as a percentage of the total ChAT+ BF and TH+ LC neurons (top) and the ChAT− BF and TH− LC neurons (bottom). ***p < 0.001; n.s., not significant (unpaired t test). G, Selectivity index for BF and LC neurons innervating the sensory cortices (mean ± SEM). Note that ChAT+ BF neurons show the highest selectivity. ChAT+ BF, n = 36; ChAT− BF, n = 36; TH+ LC, n = 34; TH− LC, n = 34. ***p < 0.001; *p < 0.05; n.s., not significant (unpaired t test). H, Number of cholinergic BF and noradrenergic LC neurons traced from the same primary sensory cortices. Number of immunostained, retrobead-labeled neurons traced from V1 (red; n = 6), A1 (green; n = 8), and S1 (blue; n = 10) in the BF and LC. *p < 0.05; **p < 0.01; ***p < 0.001 (paired t test). n represents the number of injection sites.
Figure 6.
Figure 6.
The selectivity of BF projections to the sensory cortex is not an artifact of limitations in retrobead uptake or spreading. A, Three dual retrobead injection methods: mixture (top), single (middle), and triple (bottom) injection of green and red retrobeads. For each dual injection, red retrobeads were injected into V1 and green retrobeads into A1. B, Representative images of retrobead-labeled neurons in the HDB. When we injected mixed retrobeads into V1, almost all the retrobead-labeled neurons were colabeled with green and red retrobeads (top). In the V1–A1 case, in which we injected only red retrobeads into V1, we only found red-labeled neurons in the HDB (middle and bottom). C, Same as B, but in the LC. LC neurons were colabeled with both green and red retrobeads in the case of mixed injections into V1 (top) or with single and triple V1–A1 dual injections (middle and bottom). D, Selectivity index for BF and LC neurons in the mixture, single, and triple injection groups (mean ± SEM). E, Unimodal and bimodal projecting neurons as a percentage of total retrobead-labeled neurons in the BF. F, Scatter plot of anterior-to-posterior retrobead spreading around the injection sites versus the selectivity index observed with each V1–A1 dual-injection method. Note that BF neurons show high levels of projection selectivity regardless of retrobead spreading. G, H, Same as E and F, but for LC neurons. Note that LC neurons show similar levels of selectivity with the single and triple injection methods.
Figure 7.
Figure 7.
Optogenetic activation of cholinergic BF neurons selectively modulates V1 and A1. A, Experimental schematic for the optogenetic stimulation of HDB cholinergic neurons and LFP recordings in ChAT-ChR2-EYFP mice. B, ChAT-immunostained fluorescence images of the HDB in a ChAT-ChR2-EYFP mouse. Red, ChAT; green, ChR2-EYFP; scale bars, 50 μm. C–F, LFP changes in V1 and A1 induced by optogenetic activation of cholinergic BF neurons (n = 12; 8 mice with a single-shank probe and 4 mice with a double-shank probe). C, Representative LFP traces recorded in V1 (top) and A1 (bottom). D, E, Time course (left; black line, mean; gray shading, ± SEM) and the average (right; black circle, mean; error bars, ± SEM; black lines, individual recording pairs) desynchronization ratio (power at 30–80 Hz divided by power at 1–10 Hz) in V1 (D; ***p < 0.001) and A1 (E; n.s., not significant). Blue bars in C and blue shading in D and E indicate the laser stimulation period. F, Comparison of the desynchronization ratio between V1 and A1 during laser stimulation of the HDB (***p < 0.001). Black circle, Mean; error bars, ± SEM; black lines, individual recording pairs. Red lines in D and F indicate simultaneous V1 and A1 recordings via a double-shank LCP probe (n = 4 animals). G–L, Same as A–F, but for optogenetic stimulation of the cholinergic neurons in pNB (n = 10; 6 mice with a single-shank probe and 4 mice with a double-shank probe). J, **p < 0.01; K, **p < 0.001; L, **p < 0.01. Paired t test for all statistics.
Figure 8.
Figure 8.
Noradrenergic LC neurons broadly modulate the sensory cortices. A, Experimental schematic for optogenetic stimulation of the noradrenergic LC neurons and LFP recordings in TH-ChR2-EYFP mice. B, TH-immunostained fluorescence images of the LC in a TH-ChR2-EYFP mouse. Red, TH; green, ChR2-EYFP; scale bars, 50 μm. C–E, LFP changes in V1, A1, and S1 induced by optogenetic activation of noradrenergic LC neurons (n = 8; 5 mice with a single-shank probe and 3 mice with a double-shank probe). C, Representative LFP traces recorded in V1 (left), A1 (middle), and S1 (right). D, Time course (left; black line, mean; gray shading, ± SEM) and the average (right; black circle, mean; error bars, ± SEM; black lines, individual recording pairs) desynchronization ratio in V1 (left; ***p < 0.001), A1 (middle; **p < 0.01), and S1 (right; *p < 0.05). Blue bars in C and blue shading in D indicate the laser stimulation period. E, Comparison of the desynchronization ratio among V1, A1, and S1 during laser stimulation of the LC (n.s., not significant). Black circle, mean; error bars, ± SEM; black lines, individual recording pairs. Red lines in D and E indicate simultaneous V1 and A1 recordings via a double-shank LCP probe (n = 3 animals).
Figure 9.
Figure 9.
Schematic indicating selective BF and divergent LC projections into V1, A1, and S1. A, Top and coronal views of the brain areas, including the sensory cortices, the BF, and the LC. Black arrows, diverging inputs; colored arrows, selective inputs (red for V1-selective, green for A1-selective, and blue for S1-selective projections). B, Sagittal view of the brain illustrating the selective BF and divergent LC projections into V1, A1, and S1.

References

    1. Aston-Jones G, Rajkowski J, Kubiak P, Alexinsky T. Locus coeruleus neurons in monkey are selectively activated by attended cues in a vigilance task. J Neurosci. 1994;14:4467–4480. - PMC - PubMed
    1. Berridge CW, Waterhouse BD. The locus coeruleus–noradrenergic system: modulation of behavioral state and state-dependent cognitive processes. Brain Res Rev. 2003;42:33–84. doi: 10.1016/S0165-0173(03)00143-7. - DOI - PubMed
    1. Bigl V, Woolf NJ, Butcher LL. Cholinergic projections from the basal forebrain to frontal, parietal, temporal, occipital, and cingulate cortices: a combined fluorescent tracer and acetylcholinesterase analysis. Brain Res Bull. 1982;8:727–749. doi: 10.1016/0361-9230(82)90101-0. - DOI - PubMed
    1. Bloem B, Schoppink L, Rotaru DC, Faiz A, Hendriks P, Mansvelder HD, van de Berg WD, Wouterlood FG. Topographic mapping between basal forebrain cholinergic neurons and the medial prefrontal cortex in mice. J Neurosci. 2014;34:16234–16246. doi: 10.1523/JNEUROSCI.3011-14.2014. - DOI - PMC - PubMed
    1. Brashear HR, Zaborszky L, Heimer L. Distribution of gabaergic and cholinergic neurons in the rat diagonal band. Neuroscience. 1986;17:439–451. doi: 10.1016/0306-4522(86)90258-7. - DOI - PubMed

Publication types

LinkOut - more resources