. 2016 May 11;36(19):5385-96.
doi: 10.1523/JNEUROSCI.0385-16.2016.

Limitations of Neural Map Topography for Decoding Spatial Information

Affiliations

Limitations of Neural Map Topography for Decoding Spatial Information

Lilach Avitan et al. J Neurosci. .

Abstract

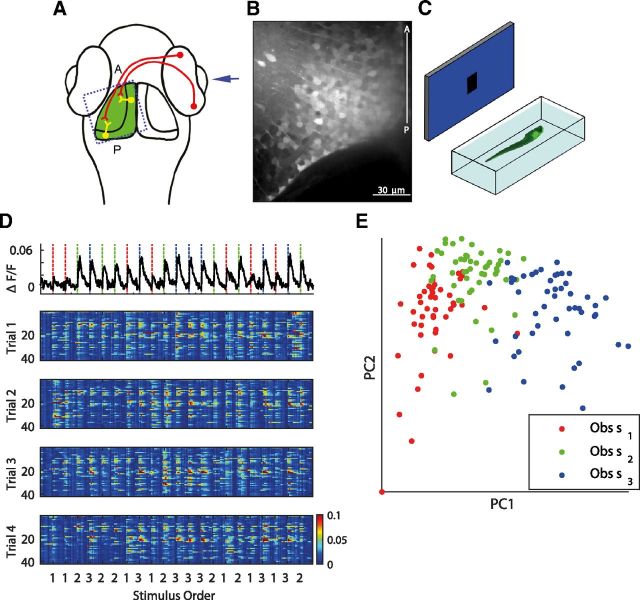
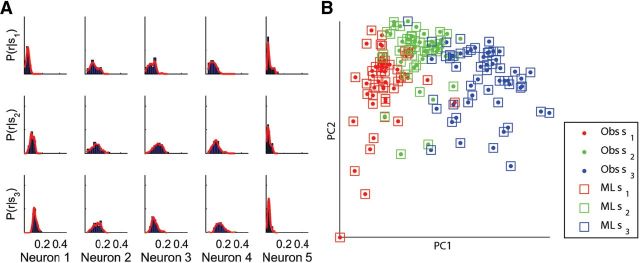
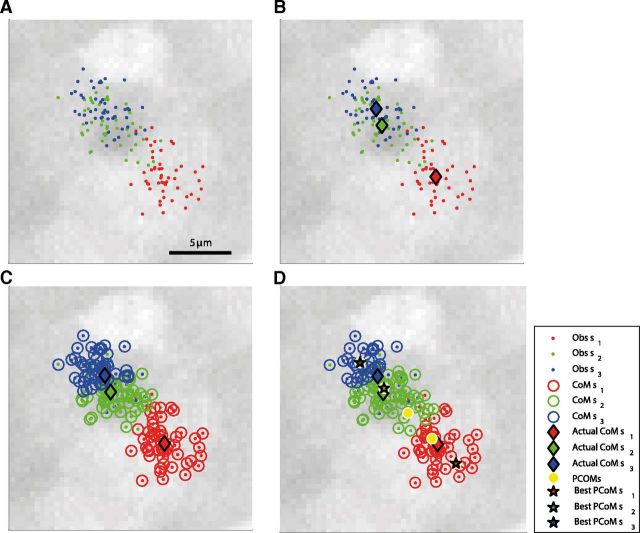
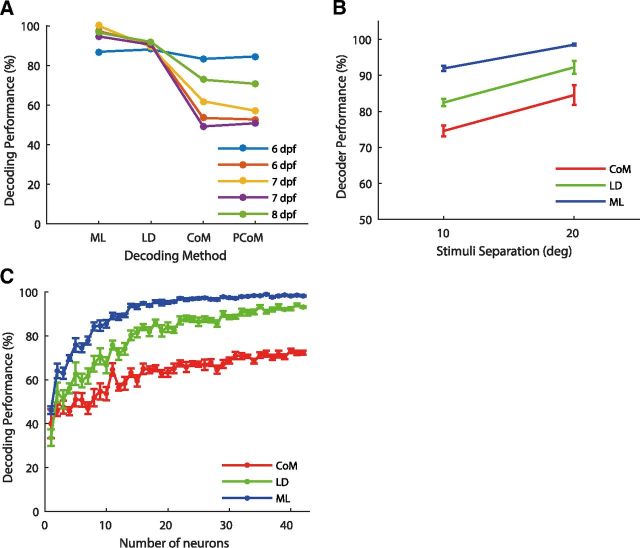
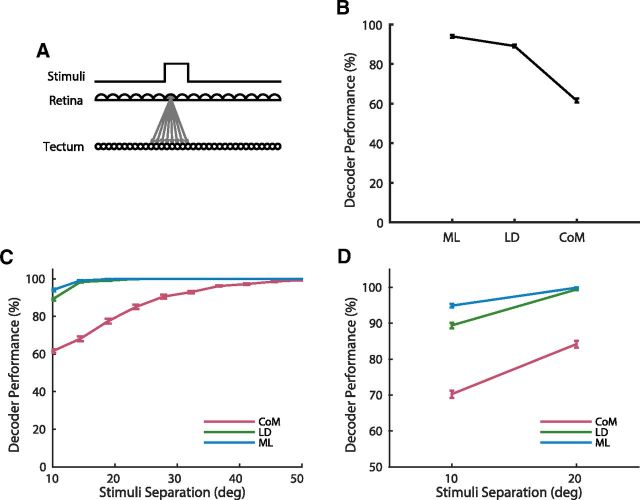
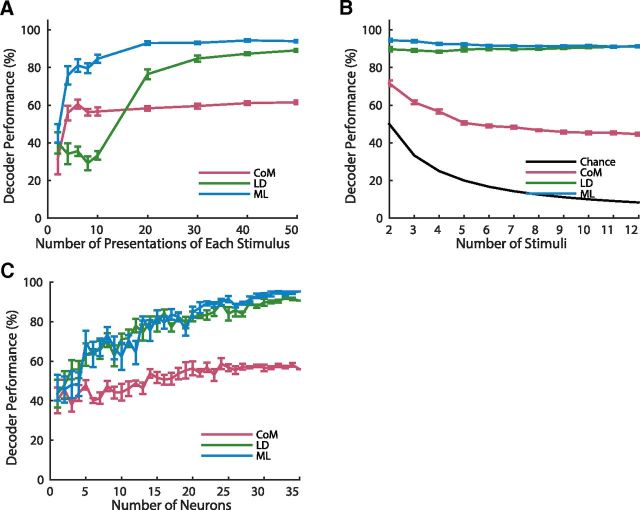
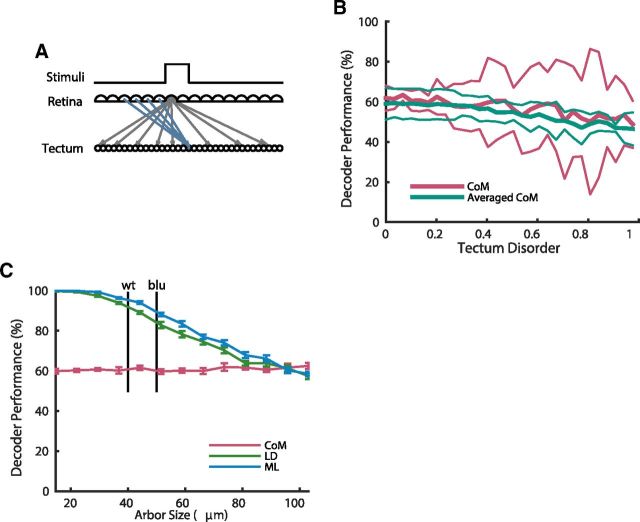
Topographic maps are common throughout the nervous system, yet their functional role is still unclear. In particular, whether they are necessary for decoding sensory stimuli is unknown. Here we examined this question by recording population activity at the cellular level from the larval zebrafish tectum in response to visual stimuli at three closely spaced locations in the visual field. Due to map imprecision, nearby stimulus locations produced intermingled tectal responses, and decoding based on map topography yielded an accuracy of only 64%. In contrast, maximum likelihood decoding of stimulus location based on the statistics of the evoked activity, while ignoring any information about the locations of neurons in the map, yielded an accuracy close to 100%. A simple computational model of the zebrafish visual system reproduced these results. Although topography is a useful initial decoding strategy, we suggest it may be replaced by better methods following visual experience.

Significance statement: A very common feature of brain wiring is that neighboring points on a sensory surface (eg, the retina) are connected to neighboring points in the brain. It is often assumed that this "topography" of wiring is essential for decoding sensory stimuli. However, here we show in the developing zebrafish that topographic decoding performs very poorly compared with methods that do not rely on topography. This suggests that, although wiring topography could provide a starting point for decoding at a very early stage in development, it may be replaced by more accurate methods as the animal gains experience of the world.

Keywords: computational model; sensory decoding; topographic map; zebrafish.


Figures

Figure 1.
Figure 1.
The population response is variable and largely overlapping. A, Dorsal view of the zebrafish head. Visual information enters the eye and is conveyed to the contralateral tectum via retinal ganglion cell axons, which synapse to the dendrites of the tectal SPV cells. Dotted, blue square indicates the region being imaged. The anterior (A) and posterior (P) ends of the tectum are indicated. B, A labeled tectum after injection of OGB. Middle-third of the tectum is cropped. C, Schematic of the visual stimulation assay. A zebrafish embedded in a chamber was imaged using confocal spinning disk microscopy. The eye contralateral to the labeled tectum was presented with a screen onto which the visual stimuli were projected. Visual stimuli consisting of 10° spots at three different positions (−10°, 0°, 10°) were randomly presented for 1 s each, followed by 8 s of blank screen. D, Top, Calcium signal from a randomly chosen cell. Dashed vertical lines represent the onset of spot presentations (red, −10°; green, 0°; blue, 10°). This particular cell responded to all three stimuli and showed variability in response amplitude to the same stimulus. Bottom, Multi-trial raster plot of evoked calcium transients induced in a population of 42 tectal cells (4 of 7 trials are shown) with many cells active due to the three stimuli presented. Stimuli were presented in a random order. E, Population response vectors projected onto the two-dimensional space defined by the first two principal components. The identity of the stimulus which evoked the response (dots) is color-coded.
Figure 2.
Figure 2.
Maximum likelihood decoding. A, Normalized histograms of cell responses due to each of the stimuli (blue bars) and their estimated probability density (red curve; 5 different cells are shown). B, Population response vectors projected onto the two-dimensional space defined by the first two principal components for one fish. The identity of the stimulus which evoked the response (dots) is color-coded as in Figure 1E. Decoded stimuli (color-coded) are also shown for each untrained population response using the ML decoder (squares). Performance is given by the percentage of observations which were decoded correctly, for this fish 97%.
Figure 3.
Figure 3.
Topography-based decoding. A, Each population vector's center of mass (dot) plotted on the relevant area of the tectum, color-coded according to the stimulus. B, CoM of population vectors elicited by the same stimulus were averaged to find the mean position due to each of the stimuli (color-coded diamonds). Due to the high degree of overlap between responses, all averaged CoMs are located within 10 μm. C, Center of mass decoding. CoM decoded stimuli (color-coded circles) for each population vector (dot). Performance is given by the percentage of observations that were decoded correctly, for this fish 73%. D, Testing whether performance could be improved by choosing different mean positions for decoding. Potential centers were considered along the extended anterior–posterior axis defined by the original mean CoMs (diamonds); here we allowed up to 50% extension of this axis, so that each of the mean potential centers could be in any of five potential spots along this axis (5 yellow circles), ie, potential CoMs (PCoMs). The best decoding performance achieved due to a particular spread of the mean potential centers is shown by the color-coded stars. CoM decoded stimuli for each untrained population vector using these PCoMs are also shown (color-coded circles). In this case performance remained similar (71% of the population vectors were decoded correctly as opposed to 73% using the original mean CoMs).
Figure 4.
Figure 4.
Performance of the decoders. A, Performance comparison for all fish using the four different decoders: the optimal decoder (ML), the linear decoder (LD), or topography-based decoder (CoM), and the topography-based decoder using potential alternative centers (PCoM). Each color represents a different fish. B, Comparison of decoder performance for 10° versus 20° separation. C, Decoding performance of ML, LD, and CoM decoders as a function of number of neurons involved. Performance rapidly saturates as the number of neurons increases. Mean and SEM from 10 simulations with different random seeds are shown.
Figure 5.
Figure 5.
A simple computational model of the retinotectal system replicated the experimental results. A, Schematic of the model, showing the step function stimulus, and retinal and tectal layers. Arrows show connections with weights >0.1 from a single retinal cell, which were defined by a normalized Gaussian. B, The performance of the three decoders, CoM, LD, and ML, in the model matched well with their performance on the experimental data (Fig. 4A). C, The performance of the decoders increased with increasing separation (ie, gap) between stimuli, with CoM taking much longer to reach saturating performance. D, Comparison of decoder performance for 10° versus 20° separation. Mean and SEM from 10 simulations shown in BD.
Figure 6.
Figure 6.
Performance of the decoders. A, Decoder performance as a function of the number of presentations of each stimulus, demonstrating that LD required more training to perform optimally. B, Decoder performance as a function of the number of stimuli discriminated, demonstrating that ML decoder is robust to the number of stimuli decoded, whereas CoM showed a decrease in performance. Mean and SEM from 10 simulations shown in A and B. C, The neuron dropping curve, showing performance as a function of the number of neurons used to perform the decoding. The performance rapidly saturated as the number of neurons increased as in the experimental data (Fig. 4C). Mean and SEM shown from five random subsets of neurons for each number of neurons.
Figure 7.
Figure 7.
Modeling of perturbed topography. A, Schematic of the model where the positions of the tectal cells were randomly shuffled but the connections kept intact. Arrows show connections with weights >0.1 from a single retinal cell (gray) and to a single tectal cell (blue). B, CoM performance as a function of the disorder of the tectum, when only stimuli at the center of the visual field were used (red), and when performance was averaged over stimuli centered at several points across the visual field (blue-green). Mean (thick lines) and 2 SD (thin lines) shown for five simulations for each level of disorder. Although some random tectal orderings resulted in the CoMs being well separated for one particular set of stimuli, leading to higher variance, this effect was abolished when performance was averaged over a variety of stimuli. C, Decoder performance as a function of arbor size, defined as the full-width at half-maximum of the Gaussian defining the connection weights. Approximate values of the arbor size of wild-type and blumenkhol mutant zebrafish are shown with vertical lines (Smear et al., 2007). LD and ML decreased in performance with increased arbor sizes, whereas CoM was unaffected. Mean and SEM from 10 simulations shown.

References

    1. Ahrens MB, Li JM, Orger MB, Robson DN, Schier AF, Engert F, Portugues R. Brain-wide neuronal dynamics during motor adaptation in zebrafish. Nature. 2012;485:471–477. doi: 10.1038/nature11057. - DOI - PMC - PubMed
    1. Averbeck BB, Latham PE, Pouget A. Neural correlations, population coding and computation. Nat Rev Neurosci. 2006;7:358–366. doi: 10.1038/nrn1888. - DOI - PubMed
    1. Beyer JE. Feeding success of clupeoid fish larvae and stochastic thinking. Dana. 1980;1:65–91.
    1. Bianco IH, Engert F. Visuomotor transformations underlying hunting behavior in zebrafish. Curr Biol. 2015;25:831–846. doi: 10.1016/j.cub.2015.01.042. - DOI - PMC - PubMed
    1. Bianco IH, Kampff AR, Engert F. Prey capture behavior evoked by simple visual stimuli in larval zebrafish. Front Syst Neurosci. 2011;5:101. doi: 10.3389/fnsys.2011.00101. - DOI - PMC - PubMed

Publication types

LinkOut - more resources