

High density of REC8 constrains sister chromatid axes and prevents illegitimate synaptonemal complex formation
- PMID: 27170622
- PMCID: PMC5278604
- DOI: 10.15252/embr.201642030
High density of REC8 constrains sister chromatid axes and prevents illegitimate synaptonemal complex formation
Abstract
During meiosis, cohesin complexes mediate sister chromatid cohesion (SCC), synaptonemal complex (SC) assembly and synapsis. Here, using super-resolution microscopy, we imaged sister chromatid axes in mouse meiocytes that have normal or reduced levels of cohesin complexes, assessing the relationship between localization of cohesin complexes, SCC and SC formation. We show that REC8 foci are separated from each other by a distance smaller than 15% of the total chromosome axis length in wild-type meiocytes. Reduced levels of cohesin complexes result in a local separation of sister chromatid axial elements (LSAEs), as well as illegitimate SC formation at these sites. REC8 but not RAD21 or RAD21L cohesin complexes flank sites of LSAEs, whereas RAD21 and RAD21L appear predominantly along the separated sister-chromatid axes. Based on these observations and a quantitative distribution analysis of REC8 along sister chromatid axes, we propose that the high density of randomly distributed REC8 cohesin complexes promotes SCC and prevents illegitimate SC formation.
Keywords: cohesin; meiosis; sister chromatid cohesion; super‐resolution microscopy; synaptonemal complex.
© 2016 The Authors.
Figures

Representative nuclear spreads of wild‐type pachytene and Rec8 −/− pachytene‐like spermatocytes. Nuclear spreads were immunostained for SYCP3 and ACA. Magnified views are indicated by dashed areas. Schematic representation on magnified chromosomes represents tightly associated sister‐AEs (separated for easier representation) in paired wild‐type homologs, and the appearance of two distinguishable/separated sister‐AEs once REC8‐mediated cohesion is lost in Rec8 −/− univalents. Scale bars, 10 μm in spreads and 1 μm on insets.
Representative nuclear spread of zygotene‐like Stag3 mutant spermatocytes. Nuclear spreads were immunostained for SYCP3 and ACA. Magnified views are indicated by dashed areas. Schematic representation on magnified univalents represents separation of sister‐AEs (centre) and close association of sister‐AEs (right). Below: graph showing the percentages of axes with separation of AEs (dark grey area) and closely associated AEs (light grey area). Four hundred and fourteen axes analysed from 11 nuclei. Scale bars, 10 μm in spreads and 1 μm on insets.
Magnified views of zygotene‐like Stag3 mutant univalents with LSAEs. Nuclear spreads were immunostained for SYCP3 and ACA. Schematic representation indicates sites of LSAEs. Below: graph showing the percentages of axes with LSAEs (red area), extensive separation of AEs (dark grey area) and closely associated AEs (light grey area). Four hundred and fourteen axes analysed from 11 nuclei. Scale bars, 1 μm.
Representative nuclear spread of zygotene‐like Smc1β −/− spermatocytes. Nuclear spreads were immunostained for SYCP3 and ACA. Magnified views are indicated by dashed areas. Schematic representation on magnified univalents represents sites of LSAEs. Below: graph showing the percentages of axes with LSAEs (red area), extensive separation of AEs (dark grey area) and closely associated AEs (light grey area). Four hundred and four axes analysed from 10 nuclei. Scale bars, 10 μm in spreads and 1 μm on insets.
STED images of representative zygotene‐like Stag3 mutant and Smc1β −/− univalents displaying LSAEs. Nuclear spreads were immunostained for SYCP3. Scale bars, 1 μm.
Graph indicating the inter‐axis distances measured in wild‐type pachytene bivalents; pachytene‐like Rec8 −/− and zygotene‐like Stag3 mutant and Smc1β −/− univalents. Each measurement in wild type and Rec8 −/− corresponds to the median of three distances measured along one homolog (n = 60). Each measurement in Stag3 mutant and Smc1β −/− mutant axes corresponds to 1 distance measured at sites of LSAEs (n = 40 and n = 20, respectively). Horizontal lines indicate median.
Graph indicating the inter‐axis distances measured at terminally and centrally located sites of LSAEs in zygotene‐like Stag3 mutant univalents. Each measurement corresponds to 1 distance measured at terminally (n = 20) and centrally (n = 20) located sites of LSAEs. Horizontal lines indicate median.
Schematic representation of the axis architecture observed in the different backgrounds analysed: close association of sister‐AEs rendering a single AE per homolog (wild type), separation of sister‐AEs, with appearance of two individual sister‐AEs (Rec8 −/−), and LSAEs rendering local “axial openings” with two individual sister‐AEs (Stag3 mutant and Smc1β −/−). Centromeres are shown in red. For easier comparison of distance between axes, a red bar of equal length was added to each chromosome drawing.

Representative wild‐type pachytene bivalents; pachytene‐like Rec8 −/− , zygotene‐like Stag3 mutant and Smc1β −/− univalents. Nuclear spreads were immunostained for SYCP1, SYCP3 and ACA. Filled arrowheads indicate sites of LSAEs with detectable SYCP1. Scale bars, 1 μm. Below: graphs showing the percentages of sites of LSAEs with detectable SC assembly along sister‐AEs of Stag3 mutant and Smc1β −/− univalents (n = 120 and n = 68, respectively).
Representative zygotene‐like Stag3 mutant univalents. Nuclear spreads were immunostained for SYCP3, ACA and SYCE1, SYCE2 and TEX12. Filled arrowheads indicate SC assembly between sites of LSAEs. Scale bars, 1 μm.
Quantification of signal distribution within sites of LSAEs, in Stag3 mutant spermatocytes. Signal distribution measured for SYCP3 and SYCP1, SYCE1, SYCE2 and TEX12. Empty arrowheads indicate signal intensity peaks that correspond to each of the two sister‐AEs, filled arrowheads indicate SYCP1 peaks.

Representative whole nuclei of wild‐type pachytene; pachytene‐like Rec8 −/− and zygotene‐like Stag3 mutant and Smc1β −/− spermatocytes. Nuclear spreads were immunostained for SYCP1, SYCP3 and ACA. Filled arrowheads indicate the bivalent and univalents shown on Fig 2A. Scale bars, 10 μm.
Representative whole nuclei of zygotene‐like Stag3 mutant spermatocytes. Nuclear spreads were immunostained for SYCP3, ACA and one of the following SC components: SYCE1, SYCE2 and TEX12. Filled arrowheads indicate the univalents shown on Fig 2B. Scale bars, 10 μm.

Representative nuclear spreads of wild‐type spermatocytes. Nuclear spreads from leptotene to diplotene stages of meiotic prophase were immunostained for REC8 and SYCP3. Scale bars, 10 μm.
Representative nuclear spreads of wild‐type spermatocytes. Nuclear spreads from leptotene to diplotene stages of meiotic prophase were immunostained for RAD21L and SYCP3. Scale bars, 10 μm.
Representative nuclear spreads of wild‐type spermatocytes. Nuclear spreads from leptotene to diplotene stages of meiotic prophase were immunostained for RAD21 and SYCP3. Scale bars, 10 μm.
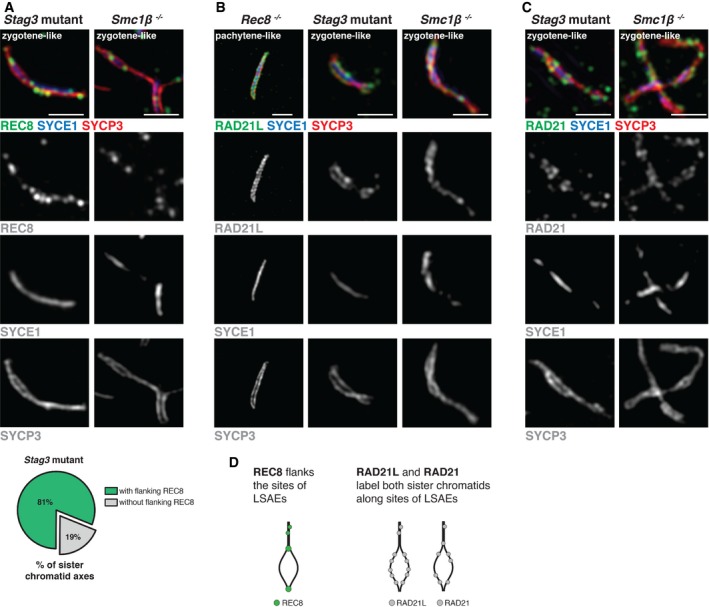
Representative zygotene‐like Stag3 mutant and Smc1β −/− univalents. Nuclear spreads were immunostained for SYCP3, SYCE1 and REC8. Below: graph showing the percentages of Stag3 mutant axes with sites of LSAEs with and without flanking REC8 foci. Seventy‐eight axes with LSAEs were analysed. Scale bars, 1 μm.
Representative pachytene‐like Rec8 −/−, zygotene‐like Stag3 mutant and Smc1β −/− univalents. Nuclear spreads were immunostained for SYCP3, SYCE1 and RAD21L. Scale bars, 1 μm.
Representative zygotene‐like Stag3 mutant and Smc1β −/− univalents. Nuclear spreads were immunostained for SYCP3, SYCE1 and RAD21. Scale bars, 1 μm.
Schematic representation of univalents axes (black lines) with sites of LSAEs, and relative distribution of REC8 (green), RAD21L (grey) and RAD21 (grey).

Representative whole nuclei of zygotene‐like Stag3 mutant and Smc1β −/− spermatocytes. Nuclear spreads were immunostained for REC8, SYCE1 and SYCP3. Filled arrowheads indicate the Stag3 mutant and Smc1β −/− univalents shown on Fig 3A. Scale bars, 10 μm.
Representative whole nuclei of zygotene‐like Stag3 mutant and Smc1β −/− spermatocytes. Nuclear spreads were immunostained for RAD21L, SYCE1 and SYCP3. Filled arrowheads indicate the Stag3 mutant and Smc1β −/− univalents shown on Fig 3B. Scale bars, 10 μm.
Representative whole nuclei of zygotene‐like Stag3 mutant and Smc1β −/− spermatocytes. Nuclear spreads were immunostained for RAD21, SYCE1 and SYCP3. Filled arrowheads indicate the Stag3 mutant and Smc1β −/− univalents shown on Fig 3C. Scale bars, 10 μm.
Representative whole nuclei from early zygotene‐like to pachytene‐like stages in Rec8 −/− spermatocytes. Nuclear spreads were immunostained for RAD21L, SYCE1 and SYCP3. Magnified views shown in (E) are represented by dashed areas on nuclear spreads. Filled arrowhead indicates the Rec8 −/− univalent shown on Fig 3B. Scale bars, 10 μm.
Magnified views of Rec8 −/− univalents shown in (D). Magnified univalents from early zygotene‐like to pachytene‐like stages of meiotic prophase were immunostained for RAD21L, SYCE1 and SYCP3. Scale bars, 1 μm.

Representative wild‐type pachytene sex chromosomes. Nuclear spreads of pachytene spermatocytes were immunostained for SYCP3. Filled arrowheads indicate the PAR. Dashed area indicated in the centre panel corresponds to the magnified view on the right panel. Scale bars, 10 μm in spreads and 1 μm on insets.
Graph indicating the inter‐axis distances measured at sites of LSAEs in zygotene‐like Stag3 mutant univalents and along pachytene wild‐type X chromosomes. Each measurement in the X chromosomes corresponds to the median of three distances (according to the scheme in figure) (n = 54). Each measurement in Stag3 mutant corresponds to 1 distance measured at sites with local separation of axial elements (n = 40). Horizontal lines indicate median. P < 0.0001 obtained with two‐tailed Mann–Whitney test. Below: schematic representation of the XY pair: sister‐AEs are coloured in black and grey for easier visualization. Filled arrowhead indicates PAR. Purple bars in scheme indicate regions where inter‐axis distances are measured.
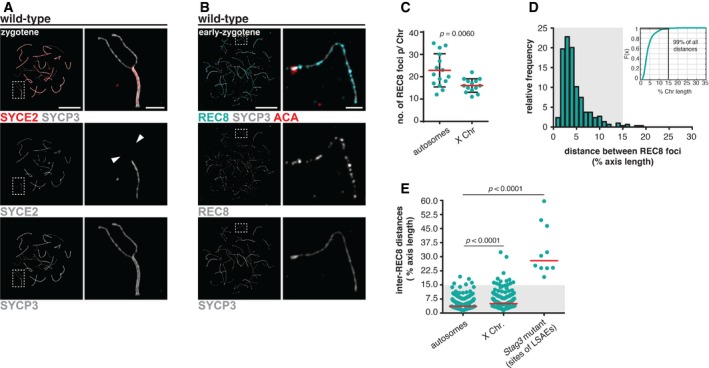
Representative pachytene wild‐type sex chromosomes. Nuclear spreads of pachytene spermatocytes were immunostained for SYCP3 and SYCE2. Dashed area indicated in centre panel corresponds to the magnified view on the right panel. Empty arrowhead indicates two discernable sister‐AEs without SYCE2. Scale bars, 10 μm in spreads and 1 μm on insets.

Analysis of REC8 distribution in representative pachytene wild‐type sex chromosomes. Nuclear spreads of pachytene spermatocytes were immunostained for SYCP3 and REC8. Scale bars, 10 μm in spreads and 1 μm on insets. Magnified XY pair is indicated by dashed area. Scatterplot showing the number of REC8 foci per X chromosome. Two hundred and twenty‐five foci identified in 14 X chromosomes. Horizontal line indicates the mean, and error bar indicates s.d. = 3.02.
Top: representative computationally straightened pachytene wild‐type X chromosomes. Nuclear spreads were immunostained for SYCP3 and REC8. Chromosomes were aligned at the PAR and subdivided into 25 regular intervals. Scale bar, 1 μm. Below: histogram showing the distribution of the percentages of REC8 foci (n = 225) among 25 regular intervals along 14 X chromosomes. Dotted line indicates mean.
Histogram showing the relative frequency of inter‐REC8 distances along X chromosomes. Two hundred and eleven inter‐REC8 distances from 14 X chromosomes. Grey area represents 15% of the chromosome axis length. The respective cumulative distribution function is shown.
Histogram showing the best fit of the observed inter‐REC8 distances to the gamma distribution. Green curve indicates the best fit of the observed inter‐REC8 distances. ν indicates the value for which the best fit was obtained, with estimated s.e. = 0.27.
Graph comparing the median distance of REC8 foci with computationally predicted even and random distributions. Median distances between foci subdivided into three categories (11–14, 15–18 and 19–22 REC8 foci per chromosome). Purple asterisk indicates the median distance of all REC8 foci.
Scatterplot comparing inter‐REC8 distances along on X chromosomes with the distances between flanking REC8 foci at sites of LSAEs in the Stag3 mutant. Two hundred and eleven inter‐REC8 distances measured along X chromosomes and 10 distances measured between flanking REC8 foci in Stag3 mutant. Grey area represents 15% of the chromosome axis length. Horizontal lines indicate the median. P < 0.0001 obtained with two‐tailed Mann–Whitney test.
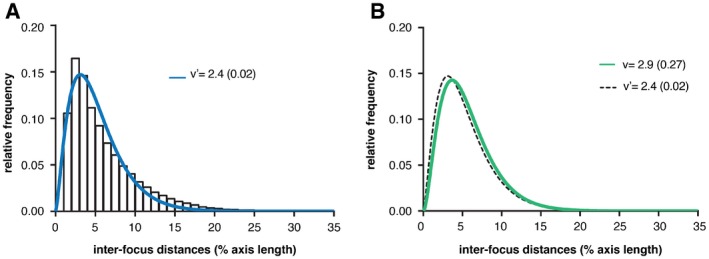
Histogram showing the relative frequency of computationally generated inter‐focus distances (grey bars) and the best fit of the distances to the gamma distribution (blue curve). ν′ indicates the value for which the best fit was obtained. Estimated s.e. = 0.02.
Graph comparing the best fit of the observed inter‐REC8 distances to the gamma distribution (green curve), and the best fit of computationally generated inter‐focus distances (dashed curve). ν indicates the value for which the best fit was obtained for the inter‐REC8 distances, with estimated s.e. = 0.27. ν′ indicates the value for which the best fit was obtained for the computationally generated inter‐focus distances, with estimated s.e. = 0.02.
Representative yet‐unsynapsed autosome from wild‐type zygotene spermatocytes. Nuclear spreads were immunostained for SYCP3 and SYCE2. Magnified autosome is indicated by dashed area. Filled arrowheads indicate yet‐unsynapsed axes regions. Scale bars, 10 μm in spreads and 1 μm on insets.
Representative unsynapsed autosome from wild‐type zygotene spermatocytes. Nuclear spreads were immunostained for SYCP3, REC8 and ACA. Magnified autosome is indicated by dashed area. Scale bars, 10 μm in spreads and 1 μm on insets.
Scatterplot comparing the average number of REC8 foci along zygotene unsynapsed autosomes and X chromosomes. The number of REC8 foci were quantified along 15 zygotene autosomes and 14 X chromosomes. Each dot represents the number of REC8 foci on each chromosome. Total number of foci identified in zygotene autosomes (343), and in X chromosomes (225). Horizontal lines indicate the mean, error bars indicate s.d. = 7.42 and 3.02 for zygotene autosomes and X chromosomes, respectively. P = 0.0060 obtained with two‐tailed Mann–Whitney test.
Histogram showing the relative frequency of inter‐REC8 distances along yet‐unsynapsed zygotene autosomes. Two hundred and ninety‐four inter‐REC8 distances analysed in 14 chromosomes. Grey area represents 15% of the chromosome axis length. The respective cumulative distribution function is shown.
Scatterplot comparing the measured inter‐REC8 distances on yet‐unsynapsed zygotene autosomes, X chromosomes and sites of LSAEs in Stag3 mutant. Number of inter‐REC8 distances for yet‐unsynapsed zygotene autosomes, X chromosomes and sites of local separation of axial elements in Stag3 mutant, n = 294, n = 211 and n = 10, respectively. Horizontal lines indicate the median. P < 0.0001 obtained with two‐tailed Mann–Whitney test.
Comment in
-
The cohesin REC8 prevents illegitimate inter-sister synaptonemal complex assembly.EMBO Rep. 2016 Jun;17(6):783-4. doi: 10.15252/embr.201642544. Epub 2016 May 11. EMBO Rep. 2016. PMID: 27170621 Free PMC article.
References
-
- Gutierrez‐Caballero C, Herran Y, Sanchez‐Martin M, Suja JA, Barbero JL, Llano E, Pendas AM (2011) Identification and molecular characterization of the mammalian alpha‐kleisin RAD21L. Cell Cycle 10: 1477–1487 - PubMed
Publication types
MeSH terms
Substances
LinkOut - more resources
Full Text Sources
Other Literature Sources
Research Materials
