. 2017 Mar;37(3):951-966.
doi: 10.1177/0271678X16648710. Epub 2016 Jul 20.

Non-signalling energy use in the developing rat brain

Affiliations

Non-signalling energy use in the developing rat brain

Elisabeth Engl et al. J Cereb Blood Flow Metab. 2017 Mar.

Abstract

Energy use in the brain constrains its information processing power, but only about half the brain's energy consumption is directly related to information processing. Evidence for which non-signalling processes consume the rest of the brain's energy has been scarce. For the first time, we investigated the energy use of the brain's main non-signalling tasks with a single method. After blocking each non-signalling process, we measured oxygen level changes in juvenile rat brain slices with an oxygen-sensing microelectrode and calculated changes in oxygen consumption throughout the slice using a modified diffusion equation. We found that the turnover of the actin and microtubule cytoskeleton, followed by lipid synthesis, are significant energy drains, contributing 25%, 22% and 18%, respectively, to the rate of oxygen consumption. In contrast, protein synthesis is energetically inexpensive. We assess how these estimates of energy expenditure relate to brain energy use in vivo, and how they might differ in the mature brain.

Keywords: ATP; brain development; brain slice; energy metabolism; lipids.


Figures
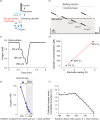
Figure 1.
Figure 1.
Measuring oxygen and calculating energy use in a brain slice. (a) A Clark-type oxygen sensor was used to measure oxygen concentration during the experiment (electrode schematic adapted from Unisense: for sensor information see Supplementary Methods). (b) Experimental outline. The oxygen sensor was placed at the surface (touching the tissue) of the hippocampal brain slice at the start of the experiment. After ∼10 min of baseline measurement, a depth profile of O2 concentration was obtained by moving the electrode along its own axis to generate a vertical depth of 50, 100, and 150 µm (the midpoint of the slice) into the slice (see Supplementary Methods). After obtaining the [O2] depth profile, the electrode was returned to the surface. Depth profiles measured with a greater spatial resolution, or with measurement points beyond the slice midpoint, did not affect the calculation of oxygen consumption through the slice (see Supplementary Figure 3). A specific blocker of an energy-consuming process was bath-perfused onto the slice for 7–20 min (see Materials and Methods and Supplementary Methods). A second [O2] depth profile was obtained at the end of the drug application, when the oxygen level had reached a plateau. After a 10–15 min recovery period and a third [O2] depth profile, 1 mM glutamate was applied to the slice and a final [O2] depth profile was obtained after oxygen levels stabilized after 3–5 min. Above the slice surface, oxygen diffuses through an unstirred layer but is not consumed. (c) Sample depth profile for [O2] through a hippocampal slice (CA1 region). The [O2] at the slice surface is lower than at the top of the static unstirred layer, where, in turn, the [O2] is lower than in the reservoir bubbled with 100% O2 (see (d)), as oxygen is lost to the air above the reservoir and through the perfusion tube walls (see Results). (d) Oxygen sensor calibration. Three bottles of distilled water were heated up to 37℃ and bubbled for at least 15 min with 0%, 20%, and 95% oxygen. The electrode was then inserted into the three solutions consecutively for a few seconds until a stable reading was obtained. Those readings were plotted against the dissolved oxygen concentrations corresponding to the different percentage saturation values for oxygen in water at 37℃, which were obtained from Henry's law as 0, 208, and 991 µM, respectively. Using the slope and intercept from the linear fit through these three points, a linear conversion to µM was then applied to the raw electrode output. (e) Oxygen measurements were taken at the end point of each depth step (blue dots). Measurements were fitted (see Materials and methods and Supplementary methods) with a modified diffusion equation (equation (1)) from the top of the unstirred layer to give Vmax, the maximum rate of oxidative phosphorylation at saturating [O2]. (f) The width of the unstirred layer was determined by moving the oxygen electrode upwards from the slice surface and calculating the break point of the [O2] profile between the unstirred layer and the bulk solution above it (see Supplementary Methods).
Figure 2.
Figure 2.
Baseline metabolic activity in a brain slice. (a) Constructing a hippocampal oxygen map of a P10 rat slice. The oxygen sensor was used to measure surface oxygen levels at each point on the schematic. The points were binned into nine distinct areas, colour-coded in (b). During the experiments reported subsequently in the paper, the electrode was placed in the CA1 region and advanced down through the slice into the stratum lacunosum-moleculare. (b) Mean ( ± s.e.m.) of oxygen concentration binned into the hippocampal regions shown in (a), n = nine slices, N = three animals. The following area measurements were binned: DGG (dentate gyrus granule cells) points 1–6, DG (dentate gyrus) 7–8 and 25–26, CA4 9, CA3P (CA3 pyramidal cells) 10–14, CA2P (CA2 pyramidal cells) 15–16, CA1P (CA1 pyramidal cells) 17–18, SL-M (stratum lacunosum-moleculare) 19–22, MFP (mossy fibre pathway) 23–24, and F (fimbria hippocampus) 27–28. No significant difference in oxygen level between hippocampal regions was found (p = 0.44). (c) Signalling related energy expenditure is negligible in a resting slice. Specific blockers of postsynaptic currents (and thus postsynaptic action potentials, 10 µM NBQX + 50 µM D-AP5, n = nine slices, N = four animals), presynaptic transmitter release and postsynaptic events (250 µM cadmium, n = 6, N = 2) or action potentials and synaptic events (1 µM TTX, n = 9, N = 9) were applied to different slices. Changes in oxygen level between the start of drug application and 15 min later were measured in those blockers and in a no-drug baseline condition (n = 9, N = 9). No blocker changed oxygen levels relative to control (p=0.26).
Figure 3.
Figure 3.
Sample traces for blockers of energy-consuming processes. Traces show oxygen levels on the slice surface interspersed with [O2] depth profiles (light blue bars). Oxygen levels rise when less oxygen is being consumed and fall when more oxygen is consumed (the grey dotted line is placed at the initial [O2] level at the slice surface for easier comparison). After ∼10 min of baseline (here only 5 min is shown before drug onset), the specific blocker of a non-signalling process was bath-perfused onto the slice (black bar), followed by 10–15 min of recovery and wash-in of 1 mM glutamate (open bar). Blocker application times are given in the Supplementary Methods. (a) antimycin stops all oxidative phosphorylation: near the end of the trace the variation of [O2] with depth is abolished, (b) cytochalasin D blocks actin treadmilling, (c) nocodazole inhibits microtubule turnover, (d), TOFA arrests lipid synthesis, (e) anisomycin blocks protein synthesis and (f) ouabain inhibits the sodium–potassium ATPase (no calcium in the external solution).
Figure 4.
Figure 4.
Actin cytoskeleton treadmilling accounts for about a quarter of resting energy use, and microtubule turnover uses a similar fraction of the brain's energy. (a), (b) Average oxygen concentration (mM ± s.e.m.) depth profiles for each condition (black = baseline, red = 10 µM cytochalasin D in (a) and 25 µM nocodazole in (b), green = recovery, blue = 1 mM glutamate), for block of actin ((a), n = eight slices, N = six animals) and microtubule ((b), n = 8, N = 4) turnover. Data were fitted with equation (1) from the surface to the bottom of the slice, and with equation (1) but without the oxygen consumption term across the unstirred layer to the slice surface. The fit gives Vmax, the maximum rate of oxygen use. (c), (d) Averaged Vmax ± s.e.m. (red dots) and individual Vmax values (black dots, normalised to baseline Vmax (=1)) for block of actin ((c), n = 8) and microtubule ((d), n = 8) turnover. The average fractional rate of energy consumption relative to baseline was calculated from the average of individual fits as being 75% during actin treadmilling inhibition and 78% during microtubule turnover block.
Figure 5.
Figure 5.
Lipid and protein synthesis together account for about 18% of O2 use, but O2 use on protein synthesis alone is too small to be measured. (a), (b) Average oxygen concentration ± s.e.m. across depth profiles per condition (black = baseline, red = 60 µM TOFA + 20 µM anisomycin in (a) or 20 µM anisomycin in (b), green = recovery, blue = 1 mM glutamate) for block of lipid and protein synthesis ((a), n = five slices, N = two animals) and protein synthesis alone ((b), n = 4, N = 4). (c), (d) Average Vmax ± s.e.m. (red dots) and individual Vmax (black dots, normalised to baseline Vmax (=1)) for block of lipid and protein synthesis ((a), n = 5) and protein synthesis alone ((b), n = 4). The average energy consumption was 82% of the control value when lipid and protein synthesis were blocked. No change could be detected when protein synthesis alone was inhibited.
Figure 6.
Figure 6.
Block of the sodium–potassium ATPase nearly halves oxygen use in the absence of external calcium. (a), (b) Averaged oxygen concentration ± s.e.m. across depth profiles per condition (black = baseline, red = 1 mM ouabain) for inhibition of the sodium–potassium pump in the absence ((a), n = seven slices, N = two animals) and presence ((b), n = 4, N = 4) of external calcium. Slices did not recover after ouabain application and did not react to glutamate (data not shown). (c), (d) Averaged Vmax ± s.e.m. (red dots) and individual Vmax values (black dots, normalised to baseline Vmax (=1)) for inhibition of the sodium–potassium pump in the absence ((c), n = 7) and presence ((d), n = 4) of external calcium. In ouabain, the average energy consumption was 50% of the control value in the absence of external calcium, an effect masked by the presence of calcium (see Results and Discussion).

References

    1. Attwell D, Laughlin SB. An energy budget for signaling in the grey matter of the brain. J Cereb Blood Flow Metab 2001; 21: 1133–1145. - PubMed
    1. Laughlin SB, Sejnowski T. Communication in neuronal networks. Science 2003; 301: 1870–1874. - PMC - PubMed
    1. Attwell D, Gibb A. Neuroenergetics and the kinetic design of excitatory synapses. Nat Rev Neurosci 2005; 6: 841–849. - PubMed
    1. Kety S. The general metabolism of the brain in vivo. In: Richter D (ed.) Metabolism of the nervous system, London: Pergamon, 1957, pp. 221–237. .
    1. Sokoloff L. The metabolism of the central nervous system in vivo. In: Field J, Magoun HW and Hall VE (eds) Handbook of physiology-neurophysiology, Washington: American Physiological Society, 1960, pp. 1843–1864. .

LinkOut - more resources