

Local adaptation drives thermal tolerance among parasite populations: a common garden experiment
- PMID: 27170717
- PMCID: PMC4874721
- DOI: 10.1098/rspb.2016.0587
Local adaptation drives thermal tolerance among parasite populations: a common garden experiment
Abstract
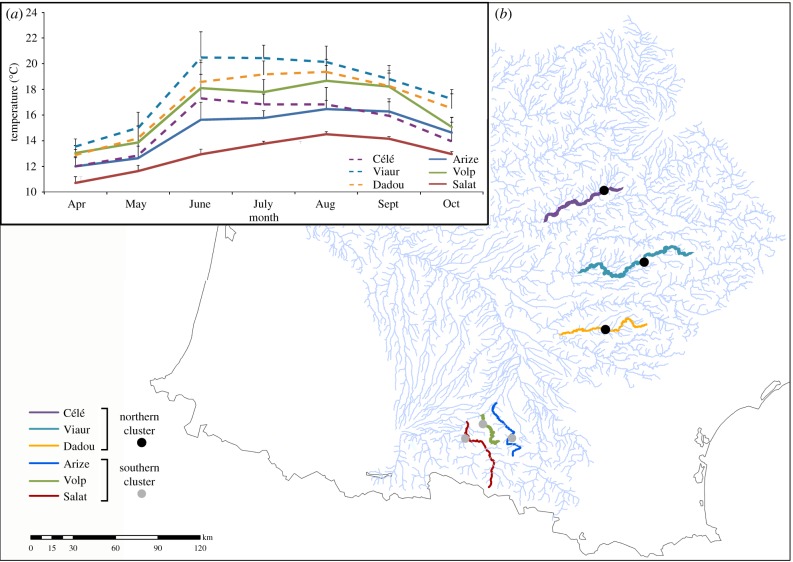
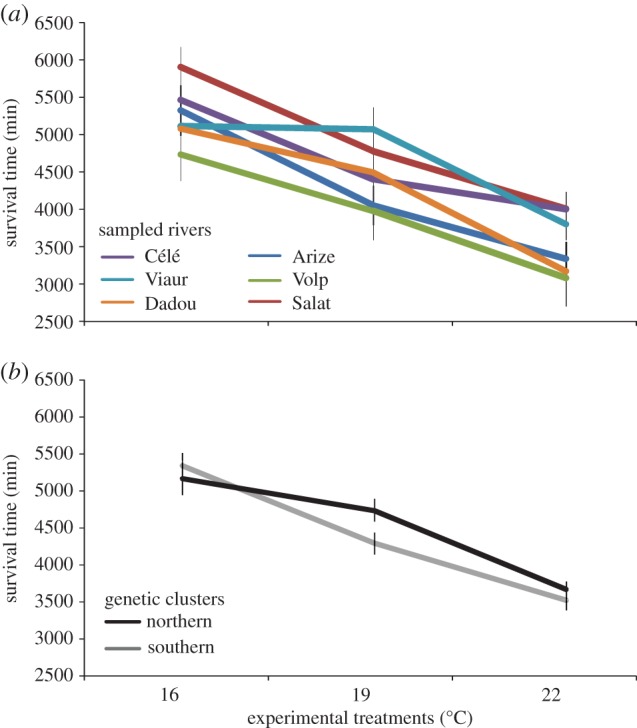
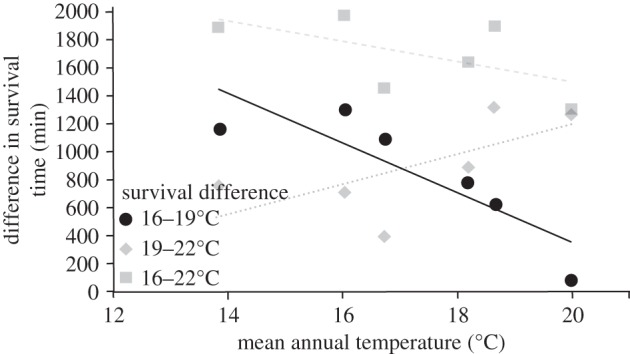
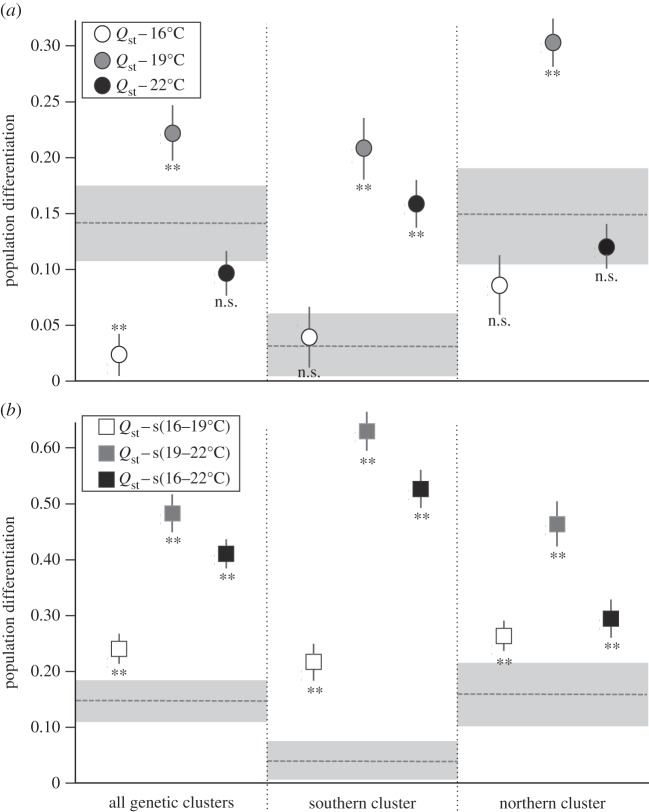
Understanding the evolutionary responses of organisms to thermal regimes is of prime importance to better predict their ability to cope with ongoing climate change. Although this question has attracted interest in free-living organisms, whether or not infectious diseases have evolved heterogeneous responses to climate is still an open question. Here, we ran a common garden experiment using the fish ectoparasite Tracheliastes polycolpus, (i) to test whether parasites living in thermally heterogeneous rivers respond differently to an experimental thermal gradient and (ii) to determine the evolutionary processes (natural selection or genetic drift) underlying these responses. We demonstrated that the reaction norms involving the survival rate of the parasite larvae (i.e. the infective stage) across a temperature gradient significantly varied among six parasite populations. Using a Qst/Fst approach and phenotype-environment associations, we further showed that the evolution of survival rate partly depended upon temperature regimes experienced in situ, and was mostly underlined by diversifying selection, but also-to some extent-by stabilizing selection and genetic drift. This evolutionary response led to population divergences in thermal tolerance across the landscape, which has implications for predicting the effects of future climate change.
Keywords: Qst/Fst; common garden experiment; ectoparasites; generalism; pre-adaptation; thermal reaction norms.
© 2016 The Author(s).
Figures
Similar articles
-
Host characteristics and environmental factors differentially drive the burden and pathogenicity of an ectoparasite: a multilevel causal analysis.J Anim Ecol. 2011 May;80(3):657-67. doi: 10.1111/j.1365-2656.2011.01804.x. Epub 2011 Feb 9. J Anim Ecol. 2011. PMID: 21303365
-
Evidence of parasite-mediated disruptive selection on genetic diversity in a wild fish population.Mol Ecol. 2009 Mar;18(6):1112-23. doi: 10.1111/j.1365-294X.2009.04099.x. Epub 2008 Feb 9. Mol Ecol. 2009. PMID: 19222748
-
The effects of the ectoparasite Tracheliastes polycolpus (Copepoda: Lernaeopodidae) on the fins of rostrum dace (Leuciscus leuciscus burdigalensis).Parasitol Res. 2004 Sep;94(1):16-23. doi: 10.1007/s00436-004-1166-9. Epub 2004 Jul 28. Parasitol Res. 2004. PMID: 15278446
-
Genomic reaction norms inform predictions of plastic and adaptive responses to climate change.J Anim Ecol. 2022 Jun;91(6):1073-1087. doi: 10.1111/1365-2656.13707. Epub 2022 May 18. J Anim Ecol. 2022. PMID: 35445402 Free PMC article. Review.
-
Evolutionary potential of upper thermal tolerance: biogeographic patterns and expectations under climate change.Ann N Y Acad Sci. 2017 Feb;1389(1):5-19. doi: 10.1111/nyas.13223. Epub 2016 Oct 5. Ann N Y Acad Sci. 2017. PMID: 27706832 Review.
Cited by
-
Variability of functional traits and their syndromes in a freshwater fish species (Phoxinus phoxinus): The role of adaptive and nonadaptive processes.Ecol Evol. 2019 Feb 14;9(5):2833-2846. doi: 10.1002/ece3.4961. eCollection 2019 Mar. Ecol Evol. 2019. PMID: 30891220 Free PMC article.
-
Molecular approaches reveal weak sibship aggregation and a high dispersal propensity in a non-native fish parasite.Ecol Evol. 2021 May 6;11(11):6080-6090. doi: 10.1002/ece3.7415. eCollection 2021 Jun. Ecol Evol. 2021. PMID: 34141204 Free PMC article.
-
Species interactions mediate thermal evolution.Evol Appl. 2019 May 9;12(7):1463-1474. doi: 10.1111/eva.12805. eCollection 2019 Aug. Evol Appl. 2019. PMID: 31417627 Free PMC article.
-
Stay in shape: Assessing the adaptive potential of shell morphology and its sensitivity to temperature in the invasive New Zealand mud snail Potamopyrgus antipodarum through phenotypic plasticity and natural selection in Europe.Ecol Evol. 2022 Oct 1;12(10):e9314. doi: 10.1002/ece3.9314. eCollection 2022 Oct. Ecol Evol. 2022. PMID: 36203624 Free PMC article.
-
Insights into the genetic diversity and species distribution of Oswaldocruzia nematodes (Trichostrongylida: Molineidae) in Europe: apparent absence of geographic and population structuring in amphibians.Parasite. 2025;32:27. doi: 10.1051/parasite/2025020. Epub 2025 Apr 23. Parasite. 2025. PMID: 40273322 Free PMC article.
References
Publication types
MeSH terms
Associated data
LinkOut - more resources
Full Text Sources
Other Literature Sources
Miscellaneous
