. 2016 Jul 11;90(15):6709-6723.
doi: 10.1128/JVI.00504-16. Print 2016 Aug 1.

HIV-1 Vpu Antagonizes CD317/Tetherin by Adaptor Protein-1-Mediated Exclusion from Virus Assembly Sites

Affiliations

HIV-1 Vpu Antagonizes CD317/Tetherin by Adaptor Protein-1-Mediated Exclusion from Virus Assembly Sites

François M Pujol et al. J Virol. .

Abstract

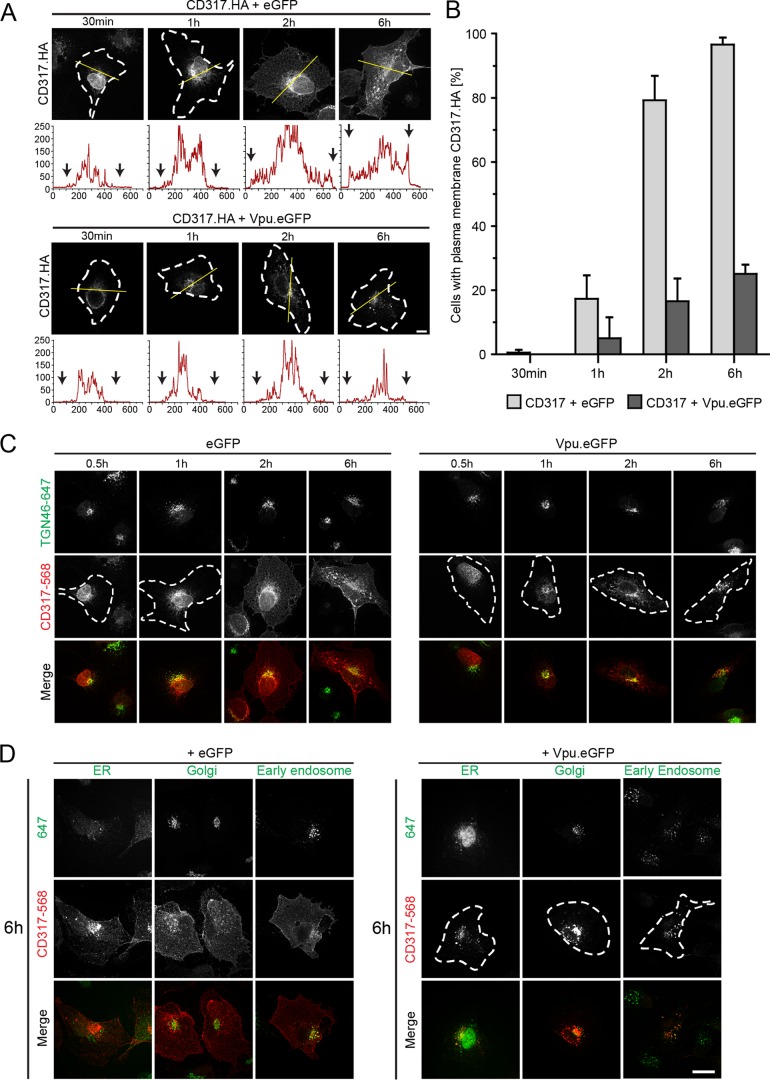
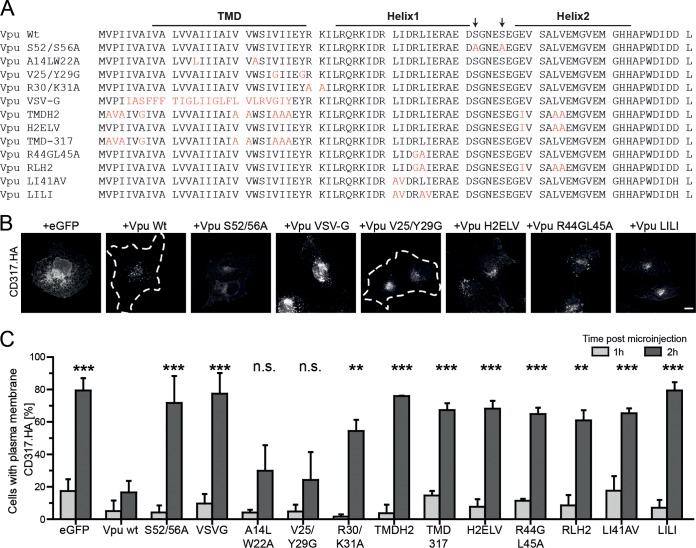
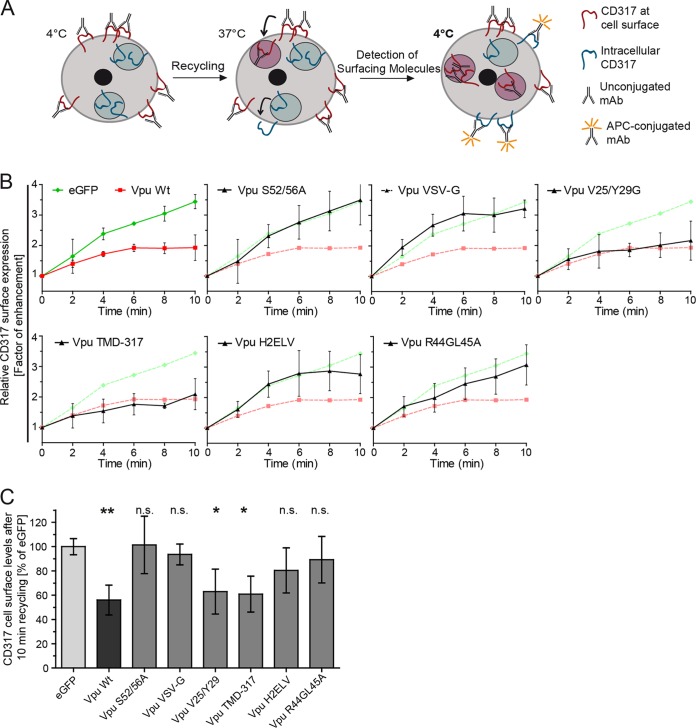
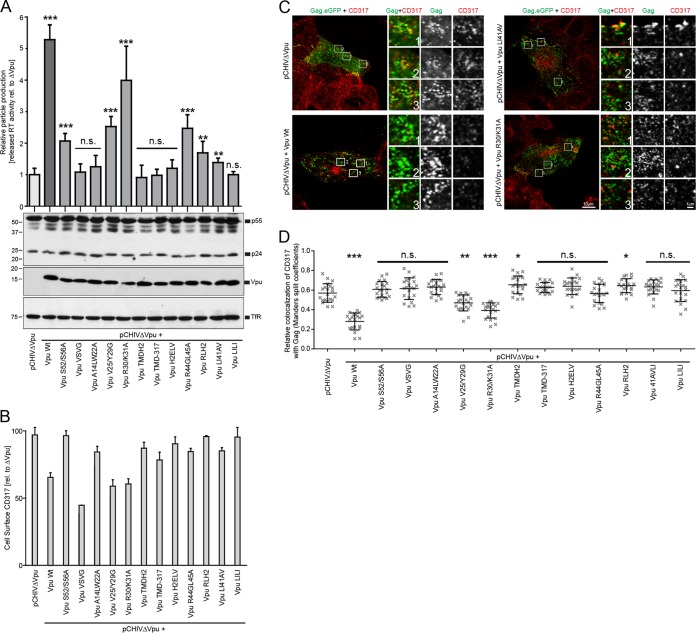
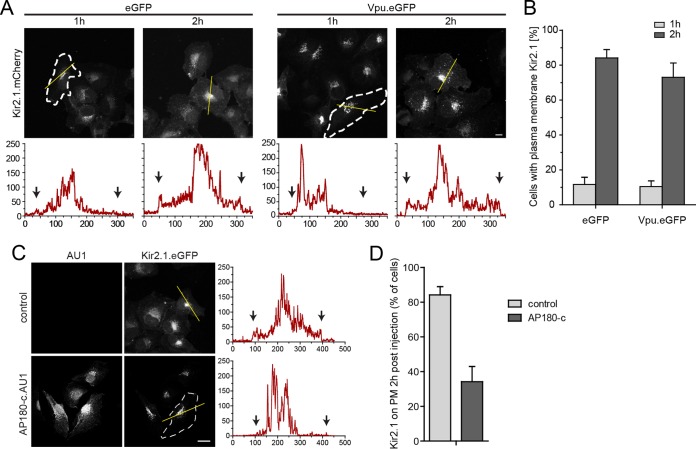
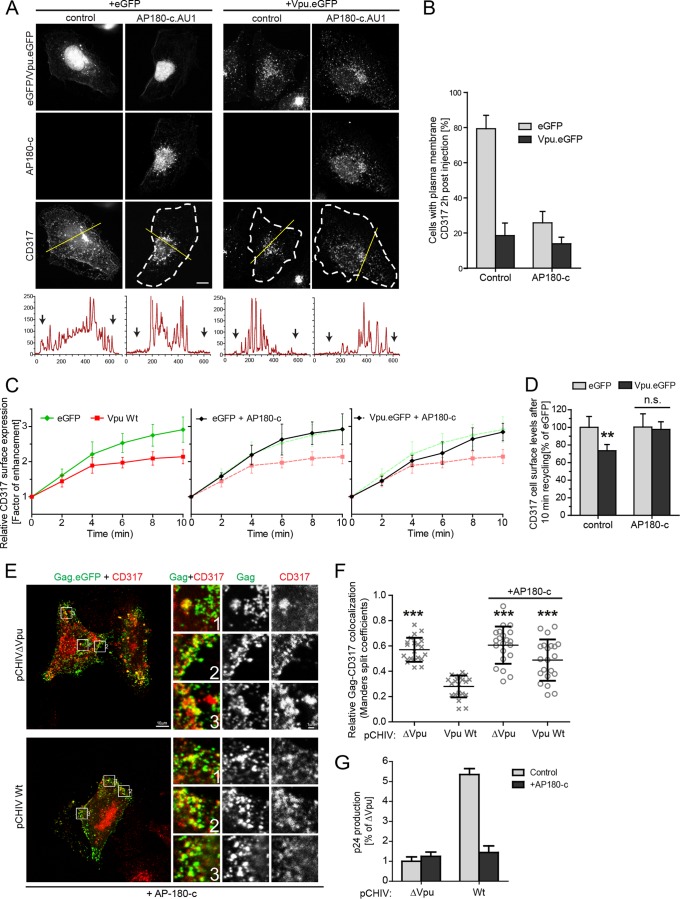
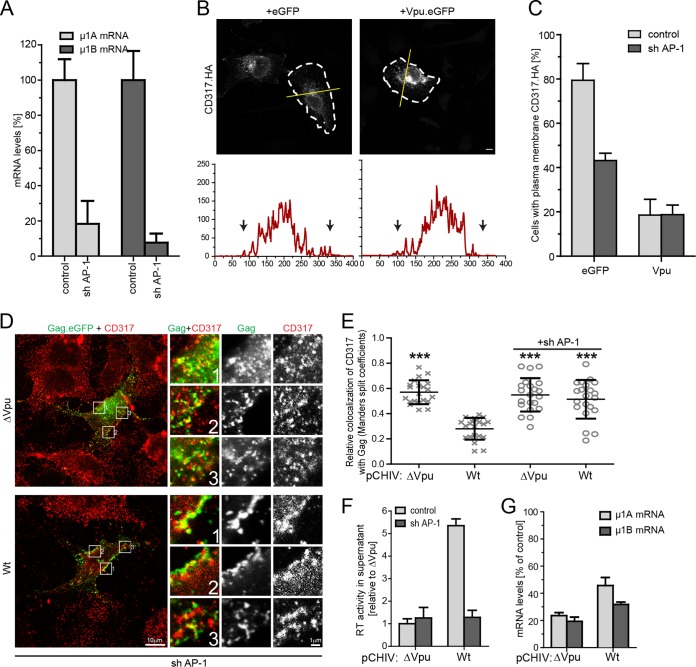
The host cell restriction factor CD317/tetherin traps virions at the surface of producer cells to prevent their release. The HIV-1 accessory protein Vpu antagonizes this restriction. Vpu reduces the cell surface density of the restriction factor and targets it for degradation; however, these activities are dispensable for enhancing particle release. Instead, Vpu has been suggested to antagonize CD317/tetherin by preventing recycling of internalized CD317/tetherin to the cell surface, blocking anterograde transport of newly synthesized CD317/tetherin, and/or displacing the restriction factor from virus assembly sites at the plasma membrane. At the molecular level, antagonism relies on the physical interaction of Vpu with CD317/tetherin. Recent findings suggested that phosphorylation of a diserine motif enables Vpu to bind to adaptor protein 1 (AP-1) trafficking complexes via two independent interaction motifs and to couple CD317/tetherin to the endocytic machinery. Here, we used a panel of Vpu proteins with specific mutations in individual interaction motifs to define which interactions are required for antagonism of CD317/tetherin. Impairing recycling or anterograde transport of CD317/tetherin to the plasma membrane was insufficient for antagonism. In contrast, excluding CD317/tetherin from HIV-1 assembly sites depended on Vpu motifs for interaction with AP-1 and CD317/tetherin and correlated with antagonism of the particle release restriction. Consistently, interference with AP-1 function or its expression blocked these Vpu activities. Our results define displacement from HIV-1 assembly sites as active principle of CD317/tetherin antagonism by Vpu and support a role of tripartite complexes between Vpu, AP-1, and CD317/tetherin in this process.

Importance: CD317/tetherin poses an intrinsic barrier to human immunodeficiency virus type 1 (HIV-1) replication in human cells by trapping virus particles at the surface of producer cells and thereby preventing their release. The viral protein Vpu antagonizes this restriction, and molecular interactions with the restriction factor and adaptor protein complex 1 (AP-1) were suggested to mediate this activity. Vpu modulates intracellular trafficking of CD317/tetherin and excludes the restriction factor from HIV-1 assembly sites at the plasma membrane, but the relative contribution of these effects to antagonism remain elusive. Using a panel of Vpu mutants, as well as interference with AP-1 function and expression, we show here that Vpu antagonizes CD317/tetherin by blocking its recruitment to viral assembly sites in an AP-1-dependent manner. These results refine our understanding of the molecular mechanisms of CD317/tetherin antagonism and suggest complexes of Vpu with the restriction factor and AP-1 as targets for potential therapeutic intervention.


Figures

FIG 1
FIG 1
Vpu blocks anterograde transport of newly synthesized CD317/tetherin. (A) HT1080 cells were microinjected with expression plasmids for CD317.HA and eGFP or NL4-3 Vpu.eGFP, fixed at the indicated time points, and the subcellular localization of CD317.HA was analyzed. Shown are representative confocal micrographs. Scale bar, 10 μm. Where not visible by PM CD317.HA, cell boundaries are indicated by white dashed lines. The yellow line denotes the section represented below each image in the intensity plot profile (x axis, gray intensity × 1,000; y axis, distance in pixels). Black arrows indicate the cell limit. (B) Quantification of the experiment shown in panel A. Depicted is the mean of the percentage ± the standard deviations (SD) of cells with PM localization of CD317.HA from three independent experiments with over 70 cells analyzed per condition and experiment. (C and D) Time course of colocalization of newly synthesized CD317/tetherin. HT1080 cells were microinjected with expression plasmids for CD317.HA and eGFP or NL4-3 Vpu.eGFP, fixed at the indicated time points, and the subcellular localization of CD317.HA were analyzed using ER, Golgi, TGN, and early endosome subcellular markers. Shown are representative confocal micrographs. Scale bar, 10 μm. Where not visible by PM CD317.HA, cell boundaries are indicated by white dashed lines. (C) Time course of colocalization of newly synthesized CD317 with TGN46 in HT1080 cells expressing eGFP or NL4.3 Vpu.eGFP. Shown are representative confocal micrographs of cells stained for TGN46 and CD317 at 0.5, 1, 2, and 6 h p.m. (D) Representative confocal micrographs of newly synthesized CD317 with ER, Golgi, and early endosome markers in HT1080 cells expressing eGFP or NL4.3 Vpu.eGFP at 6 h p.m.
FIG 2
FIG 2
Molecular determinants in Vpu for the block of anterograde transport of newly synthesized CD317/tetherin. (A) Amino acid alignment of HIV-1 NL4.3 Vpu and the mutants used in this study. Mutated residues are shown in red. (B) Microphotographs of CD317.HA localization at 2 h p.m. with the indicated CD317.HA and Vpu.eGFP expression plasmids. (C) Quantification of the experiment from panel A. Depicted are the mean percentages ± the SD of cells with PM localization of CD317.HA from three independent experiments with over 70 cells analyzed per condition and experiment. Asterisks indicate the statistical significance of differences to Vpu wt for values at 2 h p.m.
FIG 3
FIG 3
Molecular determinants in Vpu for blocking recycling of CD317/tetherin. (A) Schematic representation of the recycling assay (taken from Schmidt et al. [40]). See Materials and Methods for details. (B) Tzm-bl cells were transfected with the indicated eGFP or Vpu.eGFP expression plasmids. For clarity, results for each Vpu mutants are plotted (black) in a separate graph in comparison to the eGFP (green) and Vpu.eGFP (red) controls. Shown are relative CD317 surface levels over time as a factor of enhancement. Each point represents the mean ± the SD of three independent biological replicates. (C) Quantification of relative CD317 surface expression after 10 min of recycling (mean ± the SD of three independent experiments). Asterisks indicate the statistical significance of differences to the eGFP control.
FIG 4
FIG 4
Molecular determinants in Vpu for antagonism of the CD317/tetherin release restriction and for exclusion of the restriction factor from PM sites of virus assembly. Tzm-bl cells were transfected with pcHIV-1 ΔVpu and pcHIV-1 ΔVpu Gag-eGFP, together with an empty control vector or the indicated Vpu expression plasmid. At 48 h posttransfection, the cells were analyzed for protein expression and colocalization of CD317/tetherin with Gag.eGFP, and the amounts of RT activity in the cell culture supernatant were quantified. (A) The top panel shows the quantification of RT activity in the cell culture supernatant relative to the pCHIVΔVpu control that was arbitrarily set to 1. Bars represent the means ± the SD from three independent biological replicates. Asterisks indicate the statistical significance of differences to the pCHIVΔVpu control. The lower panel shows Western blots of cell lysates using antibodies against p24CA, Vpu, and transferrin receptor (TfR). (B) Steady-state cell surface levels of CD317/tetherin on the virus-producing cells analyzed in panel A. Bars represent means ± the SD from three independent biological replicates and express cell surface levels relative to the pCHIVΔVpu control that was set to 100%. (C) Representative confocal micrographs of the PM area of virus producing cells. Scale bar, 10 μm. Shown are merged channels of Gag.eGFP and CD317.568 (left panels), as well as merged and individual channels of the zoomed areas (indicated by boxes; scale bar, 1 μm). (D) Relative colocalization values of CD317 with Gag expressed as the Mander's split coefficient. Values obtained from 20 cells per condition are displayed as individual data points, together with the median ± the SD. Asterisks indicate statistical differences to the pCHIVΔVpu control (*, P < 0.01; **, P < 0.001; ***, P < 0.0001).
FIG 5
FIG 5
Vpu does not exert unspecific effects on AP-1 mediated anterograde transport of transmembrane proteins. (A) HT1080 cells were microinjected with expression plasmids for Kir2.1.mCherry and eGFP or NL4-3 Vpu.eGFP, fixed at the indicated time points, and the subcellular localization of Kir2.1.mCherry was analyzed. Shown are representative confocal micrographs. Scale bar, 10 μm. Where not visible by PM Kir2.1.mCherry, cell boundaries are indicated by white dashed lines. The yellow line denotes the section represented below each image in the intensity plot profile (x axis, gray intensity × 1,000; y axis, distance in pixels). Black arrows indicate the cell limit. (B) Quantification of the experiment shown in panel A. Depicted are the mean percentages ± the SD of cells with PM localization of Kir2.1.mCherry from three independent experiments with >70 cells analyzed per condition and experiment. (C) HT1080 cells were microinjected with expression plasmids for Kir2.1.mCherry and pcDNA control or pcDNA AP180-c.AU1, fixed at 2 h p.m., and the subcellular localization of Kir2.1.mCherry was analyzed. Shown are representative confocal micrographs. Scale bar, 10 μm. Where not visible by PM Kir2.1.mCherry, the cell boundaries are indicated by white dashed lines. The yellow line denotes the section represented on the right of each image in the intensity plot profile (x axis, gray intensity × 1,000; y axis, distance in pixels). Black arrows indicate the cell limit. (D) Quantification of the experiment shown in panel C. Depicted are the mean percentages ± the SD of cells with PM localization of Kir2.1.mCherry from three independent experiments with >70 cells analyzed per condition and experiment.
FIG 6
FIG 6
Effect of AP180-c on the ability of Vpu to alter CD317/tetherin trafficking and particle release restriction. (A) HT1080 cells were microinjected with expression plasmids for CD317.HA and eGFP or NL4-3 Vpu.eGFP, and with a control plasmid or an expression plasmid for AP180-c.AU1, fixed at 2 h p.m., and the subcellular localization of CD317.HA was analyzed. Shown are representative confocal micrographs. Scale bar, 10 μm. Where not visible by PM CD317.HA, the cell boundaries are indicated by white dashed lines. The yellow line denotes the section represented below each image in the intensity plot profile (x axis, gray intensity × 1,000; y axis, distance in pixels) where the black arrows indicate the cell limit. (B) Quantification of the cells shown in panel A with a detectable presence of CD317.HA on the PM. Depicted are the mean percentages ± the SD of cells with PM localization of CD317.HA from three independent experiments with >70 cells analyzed per condition and experiment. (C) Tzm-bl cells were transfected with plasmids expressing eGFP or Vpu.eGFP, together with an empty vector control or the AP180-c.AU1 expression plasmid. Shown are the relative CD317 surface levels over time as a factor of enhancement. Each point represents the mean ± the SD of three independent biological replicates. (D) Quantification of the relative CD317 surface expression after 10 min of recycling (mean ± the SD of three independent experiments). Asterisks indicate the statistical significance of differences compared to the corresponding eGFP control. (E to G) Tzm-bl cells were transfected with pcHIV ΔVpu and pcHIV ΔVpu Gag-eGFP, together with an empty control vector or the indicated Vpu expression plasmid, as well as the expression plasmid for AP180-c or the corresponding empty vector control. At 48 h posttransfection, the cells were analyzed for localization of CD317/tetherin to assembly sites, and the amounts of p24CA activity in the cell culture supernatant were quantified. (E) Representative confocal micrographs of the PM area of cells expressing AP180-c. Scale bar, 10 μm. Shown are merged channels of Gag.eGFP and CD317.568 (left panels), as well as merged and individual channels of the zoomed areas (indicated by boxes; scale bar, 1 μm). (F) Relative colocalization values of CD317 with Gag expressed as the Mander's split coefficient. Values obtained from 20 cells per condition are displayed as individual data points, together with the median ± the SD. Asterisks indicate the statistical significance of differences to wt Vpu. Values for controls are the same as in Fig. 3C. (G) Quantification of p24CA in the cell culture supernatant. Bars represent the mean p24CA amounts ± the SD from three independent biological replicates relative to the ΔVpu control without AP180-c, which was arbitrarily set to 1.
FIG 7
FIG 7
Effect of silencing AP-1 μ expression on the ability of Vpu to alter CD317/tetherin trafficking and particle release restriction. (A to C) HT1080 cells were exposed to the indicated AAVs for 3 days and then subjected to plasmid microinjection with expression plasmids for CD317.HA and eGFP or NL4-3 Vpu.eGFP, followed by anterograde transport analysis. (A) μ1A and μ1B mRNA levels at the time of microinjection. Depicted are mRNA levels relative to the AAV control (mean ± the SD from three independent measurements). (B) Subcellular localization of CD317.HA at 2 h p.m. Shown are representative confocal micrographs. Scale bar, 10 μm. Cell boundaries are indicated by white dashed lines; the yellow line denotes the section represented below each image in the intensity plot profile (x axis, gray intensity × 1,000; y axis, distance in pixel), where the black arrows indicate the cell limit. (C) Quantification of the experiment shown in panel B. Depicted are the mean percentages ± the SD of cells with PM localization of CD317.HA from three independent experiments with >70 cells analyzed per condition and experiment. (D to G) Tzm-bl cells were subjected to the indicated AAVs for 24 h and then transfected with pcHIV ΔVpu and pcHIV ΔVpu Gag-eGFP, together with an empty control or a Vpu expression plasmid. At 48 h posttransfection, cells were analyzed for subcellular localization of Gag and CD317/tetherin, AP-1 μ1A and μ1B mRNA levels and the amount of RT activity in the cell culture supernatant was quantified. (D) Representative confocal micrographs of the PM area of cells exposed to AAVsh1/2. Scale bar, 10 μm. Shown are merged channels of Gag.eGFP and CD317.568, as well as merged and individual channels of the zoomed areas (indicated by boxes; scale bar, 1 μm). (E) Relative colocalization values of CD317 with Gag expressed as the Mander's split coefficient. Values obtained from 20 cells per condition are displayed as individual data points, together with the median ± the SD. Asterisks indicate the statistical significance of differences to wt Vpu. Values for controls are the same as in Fig. 3C. (F) Quantification of RT activity in the cell culture supernatant. Bars represent the mean RT activity levels ± the SD from three independent biological replicates relative to the ΔVpu control in the presence of the AAV control that was arbitrarily set to 1. (G) μ1A and μ1B mRNA levels (mean ± the SD from three independent experiments relative to the AAV control that was arbitrarily set to 100%).

Similar articles

Cited by

References

    1. Collins KL, Chen BK, Kalams SA, Walker BD, Baltimore D. 1998. HIV-1 Nef protein protects infected primary cells against killing by cytotoxic T lymphocytes. Nature 391:397–401. doi:10.1038/34929. - DOI - PubMed
    1. Schwartz O, Marechal V, Le Gall S, Lemonnier F, Heard JM. 1996. Endocytosis of major histocompatibility complex class I molecules is induced by the HIV-1 Nef protein. Nat Med 2:338–342. doi:10.1038/nm0396-338. - DOI - PubMed
    1. Shah AH, Sowrirajan B, Davis ZB, Ward JP, Campbell EM, Planelles V, Barker E. 2010. Degranulation of natural killer cells following interaction with HIV-1-infected cells is hindered by downmodulation of NTB-A by Vpu. Cell Host Microbe 8:397–409. doi:10.1016/j.chom.2010.10.008. - DOI - PMC - PubMed
    1. Simon V, Bloch N, Landau NR. 2015. Intrinsic host restrictions to HIV-1 and mechanisms of viral escape. Nat Immunol 16:546–553. doi:10.1038/ni.3156. - DOI - PMC - PubMed
    1. Bishop KN, Holmes RK, Sheehy AM, Malim MH. 2004. APOBEC-mediated editing of viral RNA. Science 305:645. doi:10.1126/science.1100658. - DOI - PubMed

Publication types

MeSH terms

Substances