. 2013 Aug 21:1:2700309.
doi: 10.1109/JTEHM.2013.2279105. eCollection 2013.

Design and Characterization of an Osmotic Sensor for the Detection of Events Associated with Dehydration and Overhydration

Affiliations

Design and Characterization of an Osmotic Sensor for the Detection of Events Associated with Dehydration and Overhydration

Luís André Fernandes et al. IEEE J Transl Eng Health Med. .

Abstract

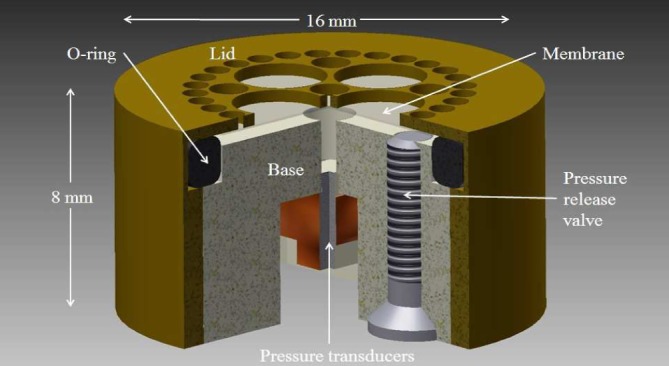
The level of hydration in the human body is carefully adjusted to control the electrolyte balance that governs the biochemical processes that sustain life. An electrolyte deficiency caused by de- or overhydration will not only limit human performance, but can also lead to serious health problems and death if left untreated. Because humans can withstand a change in hydration of only [Formula: see text], frequent monitoring should be performed in risk groups. This paper presents an osmotic hydration sensor that can record the level of hydration as a function of osmotic pressure in phosphate buffered saline or sodium-chloride solutions that simulate the interstitial fluid in the body. The osmotic pressure is recorded with the aid of an ion-exchange membrane that facilitates the migration of water and cations, in favor of reverse osmosis or gas separation membranes. The hydration sensor is designed to be coupled to an inductively powered readout circuit designed for integration in a micro-implant that has previously been shown to consume only 76 [Formula: see text] of power. The dynamic range spans a state of serious overhydration (220 [Formula: see text]) to a serious state of dehydration (340 [Formula: see text]) with a response time of [Formula: see text] (for a variation of hydration of 20%).

Keywords: Dehydration; Osmotic sensor; Osmotic strength; Overhydration; Semipermeable membrane.


Figures

Fig. 1.
Fig. 1.
CAD image of the osmotic hydration sensor. The sensor consists of a lid, membrane, O-ring, base, pressure transducers (2 pcs) and a pressure release valve. Both the lid and base are threaded (M14) to allow these two parts to connect together. The colors used are for illustration purposes only. The bulk sensor housing has been made from an acetal copolymer.
Fig. 2.
Fig. 2.
Absolute osmotic pressure as a function of changing the osmotic strength of the external test solution from 280 to 220 formula image at formula image while maintaining 280 formula image inside the reference chamber. The sensor was equipped with the Nafion 115, Nafion NR-211, Teflon, Polyamide and the ePTFE membranes. The plots are shifted vertically for clarity. The pressure ticks (y-axis) correspond to 500 mbar.
Fig. 3.
Fig. 3.
Osmotic pressure as function of the transmembrane concentration gradient in NaCl that simulates dehydration (340 formula image), normal (280 formula image) marked as the zero pressure point and overhydration (220 formula image). The theoretical line represents the osmotic pressure from formula image only. The sensor was equipped with the Nafion N115 membrane. The measured slope is a linear approximation of the experimental data.
Fig. 4.
Fig. 4.
Osmotic pressure as function of the transmembrane concentration gradient in PBS that simulates dehydration (340 formula image) marked as the zero pressure point, normal (280 formula image) and overhydration (220 formula image). The theoretical line represents the osmotic pressure from formula image only. The sensor was equipped with the Nafion N115 membrane. The measured slope is a linear approximation of the experimental data.
Fig. 5.
Fig. 5.
Repetitive measurements with the sensor equipped with the Nafion N115 membrane for a dehydration scenario in PBS from 340 to 280 formula image. All 3 experiments were conducted with the same membrane.
Fig. 6.
Fig. 6.
EDS analysis showing the composition of the Nafion N115 membrane before and after immersion in PBS for 60 hours (counts vs KeV).

References

    1. Armstrong L. E., Costill D. L., and Fink W. J., “Influence of diuretic-induced dehydration on competitive running performance,” in Med. Sci. Sports Exercise, vol. 17, pp. 456–461, Aug. 1985. - PubMed
    1. Wizemann V., Wabel P., Chamney P., Zaluska W., Moissl U., Rode C., Malecka-Masalska T., and Marcelli D., “The mortality risk of overhydration in haemodialysis patients,” in Nephrol. Dial. Transplant., vol. 24, pp. 1574–1579, May 2009. - PMC - PubMed
    1. Yeargin S. W., Susan W., Casa D. J., Armstrong L. E., Watson G., Judelson D. A., Psathas E., and Sparrow S. L., “Heat acclimatization and hydration status of american football players during initial summer workouts,” in J. Strength Condition. Res., vol. 20, pp. 463–470, Aug. 2006. - PubMed
    1. Casa D. J., Stearns R. L., Lopez R. M., Ganio M. S., McDermott B. P., Yeargin S. W., and Maresh C. M., “Influence of hydration on physiological function and performance during trail running in the heat,” in J. Athl. Train., vol. 45, pp. 147–156, Mar-Apr 2010. - PMC - PubMed
    1. Hadiwidjaja A., Howell T., Thomas C., Tong P., Method and apparatus to sense hydration level of a person, U.S. 0 048 224, Mar. 1 2007.