. 2016 Sep;84 Suppl 1(Suppl 1):4-14.
doi: 10.1002/prot.25064. Epub 2016 Jun 1.

Critical assessment of methods of protein structure prediction: Progress and new directions in round XI

Affiliations

Critical assessment of methods of protein structure prediction: Progress and new directions in round XI

John Moult et al. Proteins. 2016 Sep.

Abstract

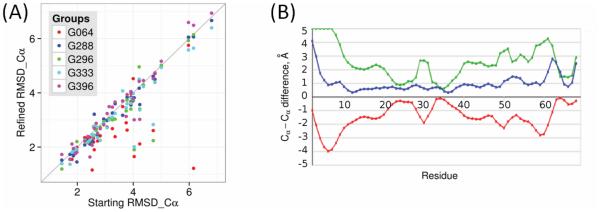
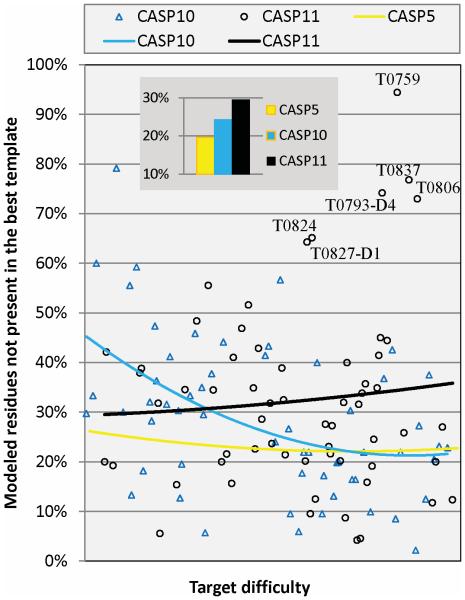
Modeling of protein structure from amino acid sequence now plays a major role in structural biology. Here we report new developments and progress from the CASP11 community experiment, assessing the state of the art in structure modeling. Notable points include the following: (1) New methods for predicting three dimensional contacts resulted in a few spectacular template free models in this CASP, whereas models based on sequence homology to proteins with experimental structure continue to be the most accurate. (2) Refinement of initial protein models, primarily using molecular dynamics related approaches, has now advanced to the point where the best methods can consistently (though slightly) improve nearly all models. (3) The use of relatively sparse NMR constraints dramatically improves the accuracy of models, and another type of sparse data, chemical crosslinking, introduced in this CASP, also shows promise for producing better models. (4) A new emphasis on modeling protein complexes, in collaboration with CAPRI, has produced interesting results, but also shows the need for more focus on this area. (5) Methods for estimating the accuracy of models have advanced to the point where they are of considerable practical use. (6) A first assessment demonstrates that models can sometimes successfully address biological questions that motivate experimental structure determination. (7) There is continuing progress in accuracy of modeling regions of structure not directly available by comparative modeling, while there is marginal or no progress in some other areas. Proteins 2016; 84(Suppl 1):4-14. © 2016 Wiley Periodicals, Inc.

Keywords: CASP; community wide experiment; protein structure modeling.


Figures

Figure 1
Figure 1
(A) Model TS064_1 of a new-fold CASP11 target T0806 superimposed on the target structure, YaaA from E. coli K-12 (RMSD to target 3.6Å); (B) Structure of the very different best available template (PDB ID 2q07). This is the first CASP example of a high accuracy model for a large (256 residues) new fold target.
Figure 2
Figure 2. CASP11 refinement performance
(A) Cα RMSDs [Å] of the refined vs. original models for some of the best performing groups. Points below the diagonal represent improvement. Where models get worse in refinement, the loss of accuracy is small. In some cases, improvements of 2Å or more are achieved. (B) Best residue-by-residue refinement of the CASP11 target TR829 (Cα-Cα distance to target for the refined (TR829TS064_2, blue) and original (T0829TS499_1, green) models, and the difference between them (improvement, red) [Å]). In this case, there are substantial improvements in the areas that were least accurate (lowest portions of the red line) in the starting structure.
Figure 3
Figure 3. Improvement in model accuracy using NMR simulated sparse data
(A) Improvement in terms of the GDT_TS score for all the CASP11 modeling targets for which sparse data were available. Scores for the best original model submitted in CASP (“unassisted”, blue), results obtained with CNS (green), and obtained by CASP participants (red) utilizing the sparse data are shown. For most targets, CASP data assisted results show a dramatic improvement in model accuracy. For example, for the first target, Ts814, GDT_TS improves from 16 to 70, corresponding to a change in Cα RMSD from 21.1 Å to 2.6 Å. Improvements using conventional CNS procedures are considerably smaller. (B) Best models obtained for CASP11 target T0777. Left: Best unassisted model (RMSD to the experimental structure is 14.7 Å); Center: Experimental structure; Right: Best model obtained with sparse data (3.7 Å RMSD).
Figure 4
Figure 4. Example of successfully identifying an inaccurate region in a model
(A) Structural superposition of the model T0766TS160_2 (magenta) and CASP11 target T0766 (cyan); (B) The poorly modeled strand-turn-strand-helix motif (residues 52-64) is detected by the accuracy estimator ModFOLD-single (green), with predicted main chain accuracy closely tracking the actual error curve (blue) (red – difference between the estimated and actual error).
Figure 5
Figure 5. Best GDT_TS scores of submitted models for targets in all CASPs, as a function of target difficulty
For recent CASPs, human/server targets only are included, and in earlier CASPs - all targets. Trend line for CASP11 runs similar to other CASPs (starting from CASP5) in the mid- and hard- sections of the difficulty range and is shorter and lower at the easy end (as there were no very easy human/server targets in CASP11, and a few short non-globular domains marked on the graph pull the curve down in that area).
Figure 6
Figure 6. Comparison of backbone accuracy of the best CASP models (CASP8-11) with the results of the frozen-in-time prediction method (SAM-T08)
Trend lines are very similar, suggesting no substantial progress.
Figure 7
Figure 7
Comparison of GDT_TS scores for models of CASP11 targets generated with a reference CASP server (FFAS03) using sequence and structure databases available during CASP11 (black) and using the databases available during the CASP8 experiment (red). Quadratic trend lines show that FFAS models using contemporary databases are often substantially improved over those possible six years earlier, because of increased database size, particularly for the now less difficult targets. Most of the improvement comes from the increased availability of suitable structure templates.
Figure 8
Figure 8. Percentage of residues successfully modeled that were not available from the single best template
Only targets in which at least 15 residues could not be aligned to the best template are included. Each point represents the best model for a target in CASP10 and 11. Quadratic fit lines are threaded through the data. The trend line for CASP5 is shown for comparison. The insert shows average improvement percentage over all targets in CASP5, 10 and 11. Clearly, CASP11 performance in this aspect improved over that of CASP5 and CASP10.

References

    1. Anfinsen CB. Principles that govern the folding of protein chains. Science. 1973;181(96):223–230. - PubMed
    1. Moult J, Pedersen JT, Judson R, Fidelis K. A large-scale experiment to assess protein structure prediction methods. Proteins. 1995;23(3):ii–v. - PubMed
    1. Moult J, Hubbard T, Bryant SH, Fidelis K, Pedersen JT. Critical assessment of methods of protein structure prediction (CASP): round II. Proteins. 1997;(Suppl 1):2–6. - PubMed
    1. Moult J, Hubbard T, Fidelis K, Pedersen JT. Critical assessment of methods of protein structure prediction (CASP): round III. Proteins. 1999;(Suppl 3):2–6. - PubMed
    1. Moult J, Fidelis K, Zemla A, Hubbard T. Critical assessment of methods of protein structure prediction (CASP): round IV. Proteins. 2001;(Suppl 5):2–7. - PubMed