. 2016 May 12;7(5):e2220.
doi: 10.1038/cddis.2016.121.

Stalled replication forks within heterochromatin require ATRX for protection

Affiliations

Stalled replication forks within heterochromatin require ATRX for protection

M S Huh et al. Cell Death Dis. .

Abstract

Expansive growth of neural progenitor cells (NPCs) is a prerequisite to the temporal waves of neuronal differentiation that generate the six-layered neocortex, while also placing a heavy burden on proteins that regulate chromatin packaging and genome integrity. This problem is further reflected by the growing number of developmental disorders caused by mutations in chromatin regulators. ATRX gene mutations cause a severe intellectual disability disorder (α-thalassemia mental retardation X-linked (ATRX) syndrome; OMIM no. 301040), characterized by microcephaly, urogenital abnormalities and α-thalassemia. Although the ATRX protein is required for the maintenance of repetitive DNA within heterochromatin, how this translates to disease pathogenesis remain poorly understood and was a focus of this study. We demonstrate that Atrx(FoxG1Cre) forebrain-specific conditional knockout mice display poly(ADP-ribose) polymerase-1 (Parp-1) hyperactivation during neurogenesis and generate fewer late-born Cux1- and Brn2-positive neurons that accounts for the reduced cortical size. Moreover, DNA damage, induced Parp-1 and Atm activation is elevated in progenitor cells and contributes to their increased level of cell death. ATRX-null HeLa cells are similarly sensitive to hydroxyurea-induced replication stress, accumulate DNA damage and proliferate poorly. Impaired BRCA1-RAD51 colocalization and PARP-1 hyperactivation indicated that stalled replication forks are not efficiently protected. DNA fiber assays confirmed that MRE11 degradation of stalled replication forks was rampant in the absence of ATRX or DAXX. Indeed, fork degradation in ATRX-null cells could be attenuated by treatment with the MRE11 inhibitor mirin, or exacerbated by inhibiting PARP-1 activity. Taken together, these results suggest that ATRX is required to limit replication stress during cellular proliferation, whereas upregulation of PARP-1 activity functions as a compensatory mechanism to protect stalled forks, limiting genomic damage, and facilitating late-born neuron production.


Figures

Figure 1
Figure 1
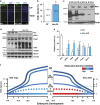
Atrx facilitates the production of late-born cortical neurons by preventing genomic instability in neural precursor cells. Representative micrographs and quantification of neurons located in the deep (a) or upper (b) neocortical layers from E18.5 Atrx cKO and WT coronal brain sections. Sections were probed with antibodies that specifically labeled the subplate (SP; Nurr1), layer VI-SP (Tbr1), and layer V (Ctip2), layers II–IV (Satb2), and layers II/III (Brn2 and Cux1). Labeled neurons within bounded areas were quantified as a percent of total nuclei within the neocortex. Values represent percent total±95% CI. *P<0.05 by z-score, whereas **P<0.01 by z-score; × 200 magnification. Scale bar, 100 μm. (c) Average cell density counts from E18.5 WT and Atrx cKO cortical sections following DAPI staining. (d) Representative IF micrographs of E13.5 Atrx cKO and WT embryos coronal brain sections stained for γ-H2AX (red) or counterstained with DAPI (blue) to label all nuclei. NPCs reside in the VZ and IZ, as indicated by dotted lines; × 200 magnification. Scale bar, 100 μm. Values represent proportional mean±S.E.M. *P<0.05 by Student's t-test
Figure 2
Figure 2
Enhanced activation of DNA-damage response pathways in Atrx cKO neuroprogenitors. (a) Representative IF micrographs of E13.5 coronal cortical sections from Atrx cKO and WT embryos stained with poly(ADP-ribose) antibodies (PAR; green) and counterstained with DAPI (blue). The cortical plate (CP) and NPC proliferative zones (VZ/IZ) are marked by dotted lines; × 200 magnification. Scale bar, 100 μm. (b) Quantification of PAR-positive nuclei shown in (a). Values represent the mean±S.E.M.; n=3; *P<0.05 by Student's t-test. (c) Protein extracts from Atrx cKO and WT cortices were harvested daily from E12.5 until E15.5 and immunoblotted for Parp-1 activity (PAR), Parp-1 or Atrx. (d) Immunoblot analysis for DNA-damage signaling in E13.5 cortical extracts from WT (n=3) and Atrx cKO (n=4) embryos. (e) Densitometry quantification of blot shown in (d). Values are the mean±S.E.M. *P<0.05; **P<0.01, by Student's t-test. (f) Developmental model of replicative stress induced loss of late-born neurons in the Atrx cKO mice. The X axis shows the developmental time and the Y axis shows the number of cycles the NPCs have undergone. Blue lines depict the generation of deep (DL) and upper layer (UL) neurons. Dotted green lines indicate the timing of progenitor cell loss. At this point, progenitors from Atrx cKO mice within the VZ/SVZ (red line) have high levels of genomic damage that compromise their survival, resulting in a smaller cortex by E18.5
Figure 3
Figure 3
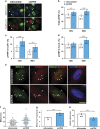
ATRX KD cells have increased activation of p53-ATM checkpoint upon mitotic progression and impaired RAD51 colocalization to BRCA1 foci. (a) Representative micrographs of phosphorylated ATMSer1981 (pATM; green) and cyclin A (CcnA; red) double IF staining of siScram- and siATRX-transfected HeLa cells at 96 h post-transfection. Arrowheads point to cells with DNA-damage foci. (b) Percentage of total interphase nuclei containing pATM foci in siATRX- versus siScram-transfected HeLa cells at 72 and 96 h post-transfection. siATRX: 72 h, n=1001; 96 h, n=1007. siScram: 72 h, n=999; 96 h, n=1009. (c) Percentage of S-G2 (CcnA+) nuclei containing pATM foci at 72 and 96 h post-transfection. siATRX: 72 h, n=365; 96 h, n=366. siScram: 72 h, n=342; 96 h, n=308. (d) Percentage of G1 (CcnA−) nuclei containing pATM foci at 72 and 96 h post-transfection. siATRX: 72 h, n=636; 96 h, n=641. siScram: 72 h, n=657; 96 h, n=701. (e) Representative micrographs of BRCA1 and RAD51 double immunostaining in siScram control and siATRX KD HeLa nuclei 72 h post-transfection. Solid arrowheads point to foci that are BRCA1+ and RAD51+ and open arrowheads point to foci that are only BRCA1+. (f) Scatterplot distribution profile of BRCA1 foci from the experiment described in (e). siScram, n=106 nuclei; siATRX, n=111 nuclei. (g) Quantification of BRCA1 foci from the experiment described in (e). siScram, n=106 nuclei; siATRX, n=111 nuclei. (h) Percentage of total BRCA1 foci positive for RAD51 from the experiment described in (e). All images are at × 630 magnification; scale bars are 20 μm (a) or 10 μm (e). For graphs, values represent percent total±95% CI except for (g), which is mean the number of BRCA1 foci±S.E.M.; **P<0.01; ***P<0.001 by z-scores (bd and h) or Student's t-test (g)
Figure 4
Figure 4
PARP-1 inhibition induces DNA breaks and causes growth suppression in ATRX KD cells. (a) Immunoblot analysis of PARP-1 inhibition by PJ34 in ATRX KD HeLa cells. As indicated, HeLa cells were transfected with siScram and siATRX. At 48 h after transfection, cells were treated with 5 μM of PARP-1 inhibitor PJ34 (+) or untreated (−) for another 24 h. Whole-cell extracts were harvested 72 h post-transfection. (b) Percentage of total nuclei containing ⩾5 bright 53BP1 foci in siScram- versus siATRX-transfected HeLa cells at 96 h post-transfection. At 72 h after transfection, cells were treated with 5 μM of PARP-1 inhibitor PJ34 (right) or untreated for another 24 h (left). Cells were fixed 96 h post-transfection and stained for 53BP1. Values represent percent total±95% CI. siScram (n=1420); siATRX (n=1607); siScram+PJ34 (n=1473); siATRX+PJ34 (n=1492). ***P<0.001 by z-scores. (c) Percentage of total nuclei containing TUNEL+ apoptotic nuclei in siScram- versus siATRX-transfected HeLa cells at 72 h post-transfection. At 48 h after transfection, cells were treated with 5 μM of PARP-1 inhibitor PJ34 (right) or untreated for another 24 h (left). Cells were fixed 72 h post-transfection and TUNEL stained. Values represent percent total±95% CI. siScram (n=2251); siATRX (n=2031); siScram+PJ34 (n=1802); siATRX+PJ34 (n=1455). ***P<0.001 by z-scores. (d) WST-1 cell viability time course of untreated (NT), siScram-, siATRX-transfected HeLa cells. Cells were seeded equally 24 h following transfection (left panel) or treated with 5 μM PJ34 24 h later (right panel). Viability measurements were assessed at day 1 (72 h post-transfection) until day 5. Values represent mean±S.E.M. For all conditions, n=4. (e) WST-1 cell viability measurement at day 5 of time courses described in (d)
Figure 5
Figure 5
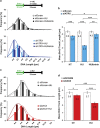
The ATRX-DAXX pathway protects stalled DNA replication forks from degradation by MRE11 exonuclease activity. (a) DNA fiber tract length distribution histogram of siScram- (top) and siATRX- (bottom) transfected HeLa cells at 72 h post-transfection. siRNA-treated cells were pulsed with BrdU and subsequently exposed to HU and mirin as indicated in the schematic. Total fibers counted for siScram experiment: no treatment, NT (n=1782); HU (n=1819); HU and mirin (n=1759). Total fibers counted for siATRX-treated cells: NT (n=1527); HU (n=1523); HU and mirin (n=1536). (b) Mean DNA fiber tract length of experiments described in (a). (c) DNA fiber tract length distribution histogram of siScram- (top) and siDAXX- (bottom) transfected HeLa cells at 72 h post-transfection. Fibers counted for siScram-treated cells were: NT (n=888); HU (n=998). Total fibers counted for siDAXX-treated cells were: NT (n=888) and HU (n=1171). (d) Mean DNA fiber tract length of experiments described in (c). For panels (b and d), the mean length±95% CI was plotted. *P<0.05, **P<0.01 and ***P<0.001 by Mann–Whitney test
Figure 6
Figure 6
A model of how ATRX suppresses genomic instability during cellular proliferation. Relevant scenarios are shown during (a) G1 phase, (b) S phase and (C) G2/M phase in the presence (left) or absence (right) of ATRX. (a) During G1, ATRX localizes to decompacted and structured DNA (e.g. G4-DNA) along with DAXX to chaperone H3.3-H4 dimers that serve as a beacon for further heterochromatinization. When cells progress into the S phase (b), DNA replication forks experience more frequent stalling events when ATRX is absent owing to an increased incidence of structured DNA. ATRX physically interacts with MRE11 and inhibits excessive MRE11-mediated resectioning of stalled replication forks, which subsequently require RAD51-mediated protection of nascent DNA. In the absence of ATRX, PARP-1 activation is upregulated in an attempt to reverse stalled replication forks and protect against further MRE11 resectioning. Cells with frequent fork stalling that progress into the G2 phase and mitosis (c) are more prone to DSBs and mutagenic non-allelic homologous recombination events (NAHR) resulting in genomic instability

References

    1. Kleefstra T, Schenck A, Kramer JM, van Bokhoven H. The genetics of cognitive epigenetics. Neuropharmacology 2014; 80: 83–94. - PubMed
    1. Gibbons RJ, Higgs DR. Molecular-clinical spectrum of the ATR-X syndrome. Am J Med Genet 2000; 97: 204–212. - PubMed
    1. Gibbons RJ, Picketts DJ, Villard L, Higgs DR. Mutations in a putative global transcriptional regulator cause X-linked mental retardation with alpha-thalassemia (ATR-X syndrome). Cell 1995; 80: 837–845. - PubMed
    1. Iwase S, Xiang B, Ghosh S, Ren T, Lewis PW, Cochrane JC et al. ATRX ADD domain links an atypical histone methylation recognition mechanism to human mental-retardation syndrome. Nat Struct Mol Biol 2011; 18: 769–776. - PMC - PubMed
    1. Noh KM, Maze I, Zhao D, Xiang B, Wenderski W, Lewis PW et al. ATRX tolerates activity-dependent histone H3 methyl/phos switching to maintain repetitive element silencing in neurons. Proc Natl Acad Sci USA 2014; 112: 6820–6827. - PMC - PubMed

MeSH terms

Substances

Grants and funding