. 2016 May 12;533(7602):225-9.
doi: 10.1038/nature17958.

Lightwave-driven quasiparticle collisions on a subcycle timescale

Affiliations

Lightwave-driven quasiparticle collisions on a subcycle timescale

F Langer et al. Nature. .

Abstract

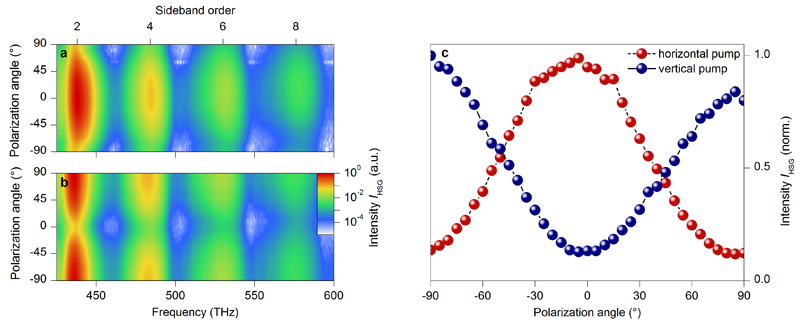
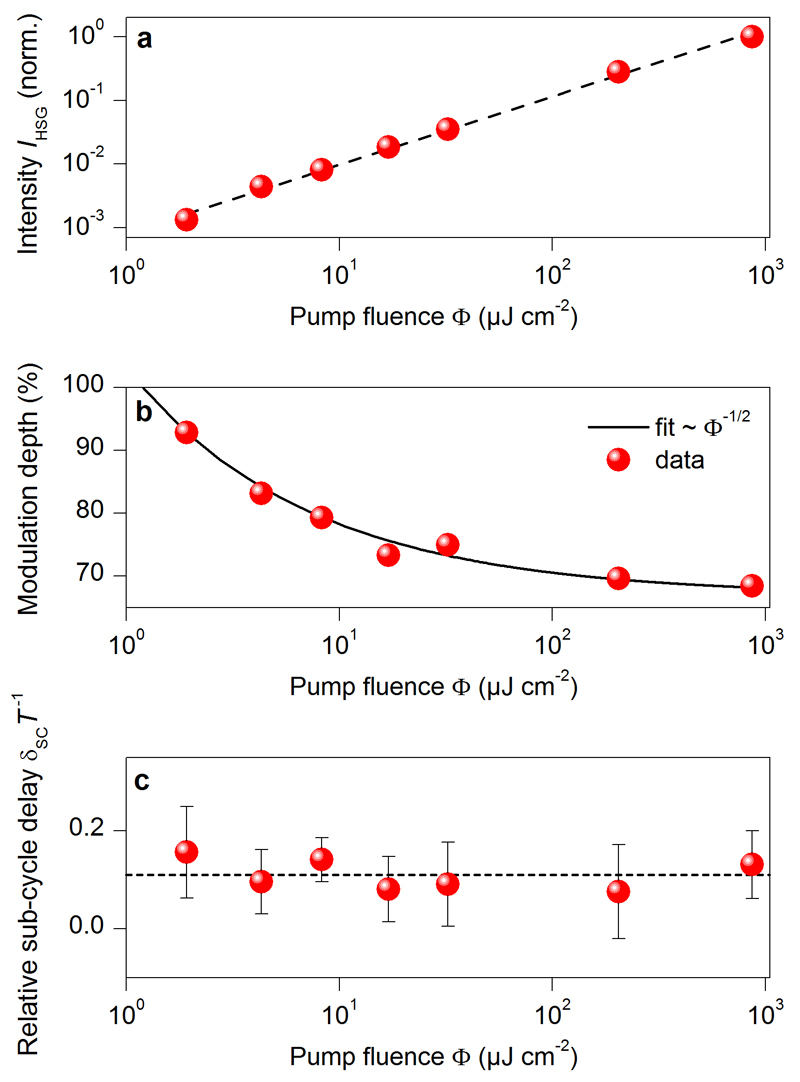
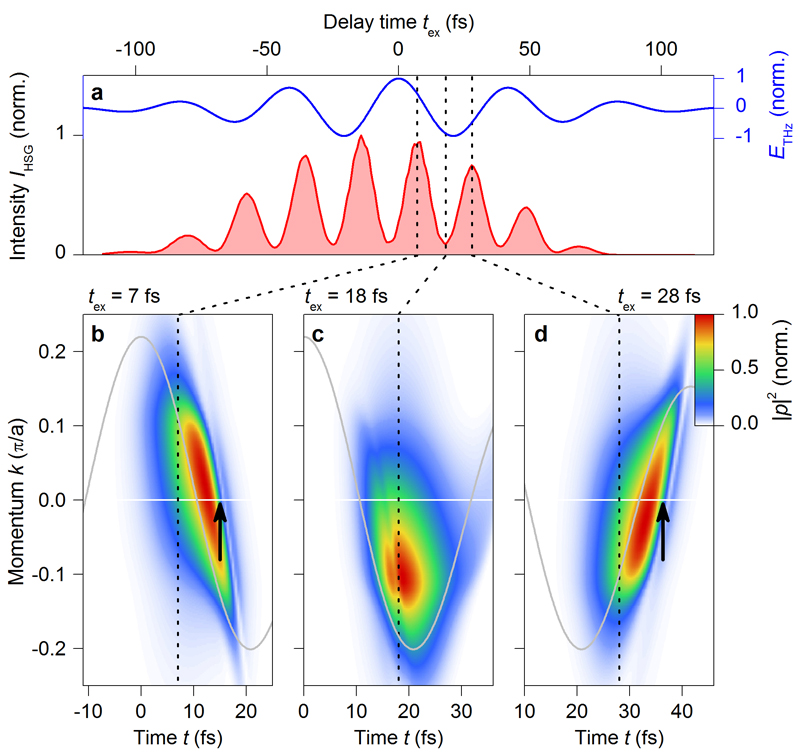
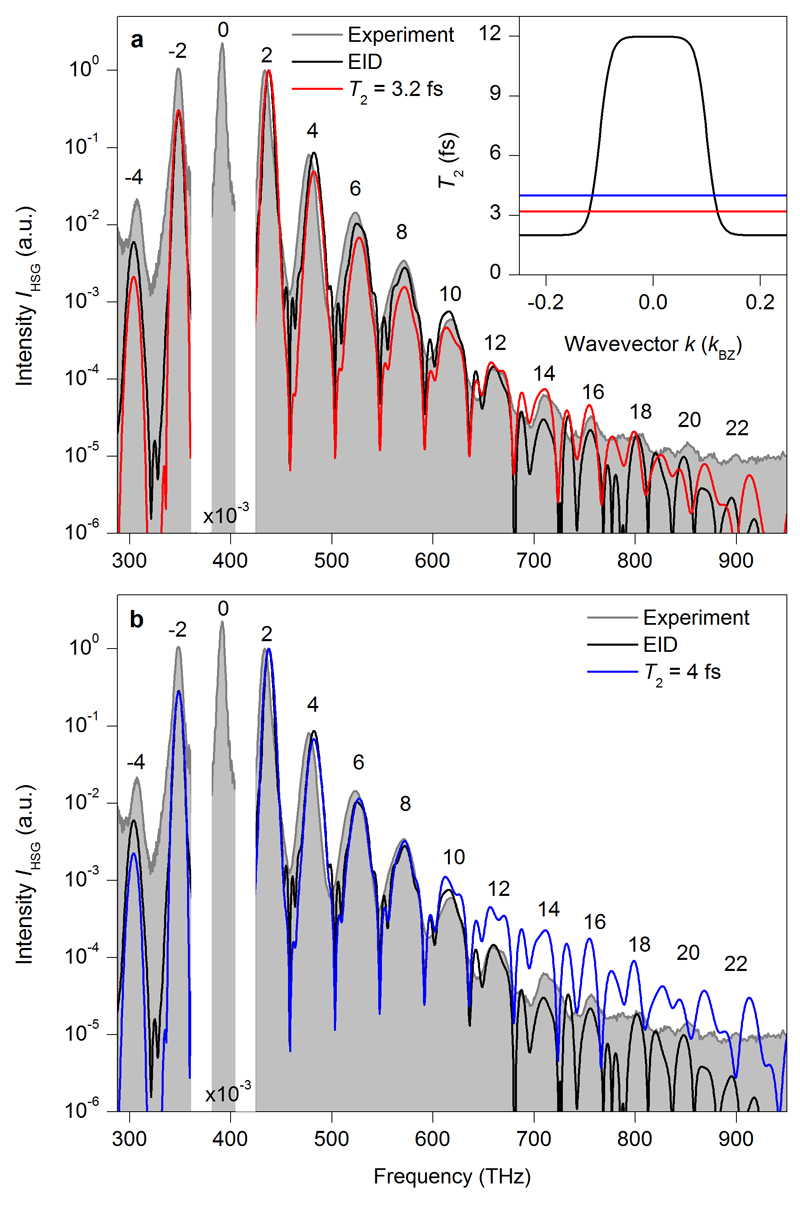
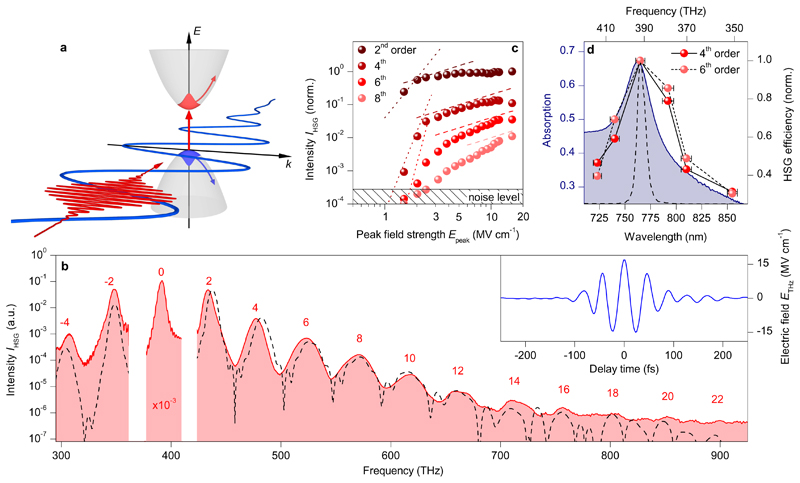
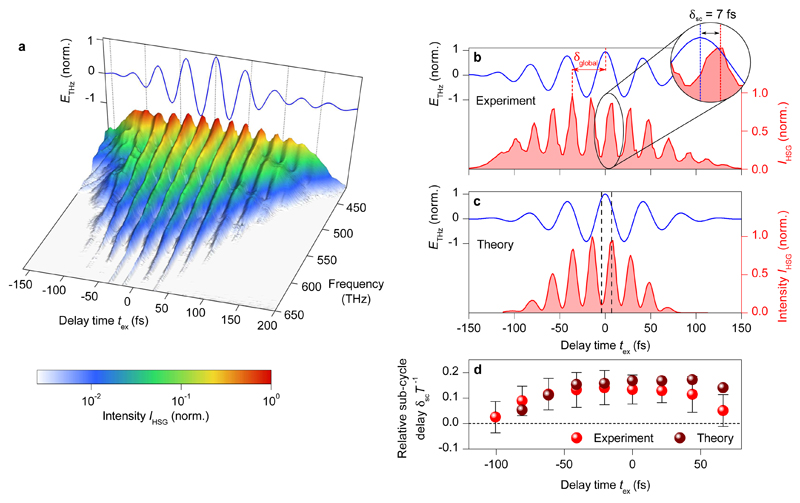
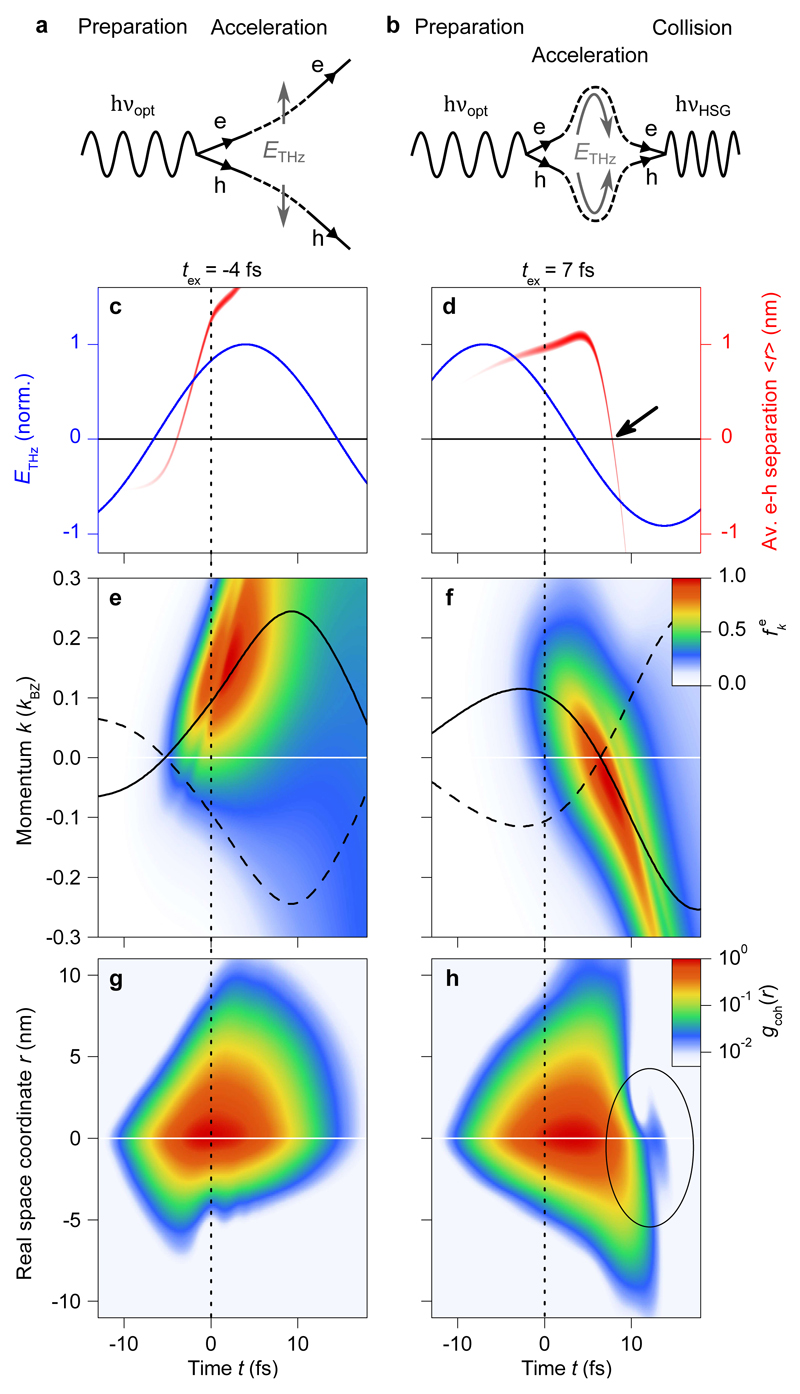
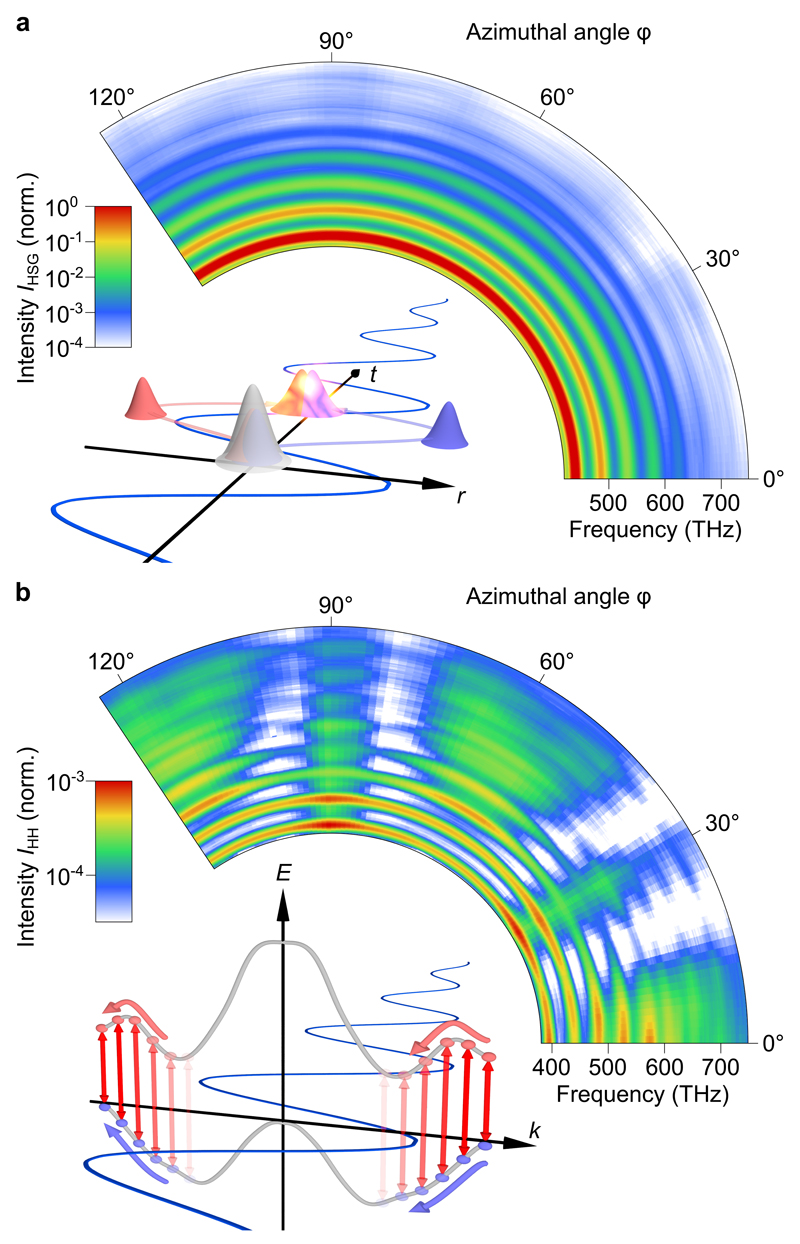
Ever since Ernest Rutherford scattered α-particles from gold foils, collision experiments have revealed insights into atoms, nuclei and elementary particles. In solids, many-body correlations lead to characteristic resonances--called quasiparticles--such as excitons, dropletons, polarons and Cooper pairs. The structure and dynamics of quasiparticles are important because they define macroscopic phenomena such as Mott insulating states, spontaneous spin- and charge-order, and high-temperature superconductivity. However, the extremely short lifetimes of these entities make practical implementations of a suitable collider challenging. Here we exploit lightwave-driven charge transport, the foundation of attosecond science, to explore ultrafast quasiparticle collisions directly in the time domain: a femtosecond optical pulse creates excitonic electron-hole pairs in the layered dichalcogenide tungsten diselenide while a strong terahertz field accelerates and collides the electrons with the holes. The underlying dynamics of the wave packets, including collision, pair annihilation, quantum interference and dephasing, are detected as light emission in high-order spectral sidebands of the optical excitation. A full quantum theory explains our observations microscopically. This approach enables collision experiments with various complex quasiparticles and suggests a promising new way of generating sub-femtosecond pulses.


Conflict of interest statement

The authors declare no competing financial interests.

Figures

Extended data Figure 1
Extended data Figure 1. Polarization of high-order sidebands.
a, b, False colour plot of the spectral intensity of high-order sidebands (generated under resonant, spectrally narrow optical excitation) of orders 2 to 8 as a function of their polarization for horizontal (a) and vertical (b) polarization of the interband excitation pulse. The polarization angle is defined such that 0° corresponds to a horizontally polarized excitation. c, Spectrally integrated sideband intensity in dependence on the polarization angle.
Extended data Figure 2
Extended data Figure 2. Pump fluence dependence of time-resolved high-order sideband generation.
a, The measured high-order sideband intensity IHSG (spectrally and temporally integrated, red spheres) scales linearly with the pump fluence Φ, as indicated by a guide to the eye (black dashed line). b, The modulation depth of the spectrally integrated temporal trace of IHSG (red spheres, comp. Figure 2b) decreases with increasing pump fluence, closely following a fit (black curve) proportional to the inverse square-root of the pump fluence. c, In contrast, the relative sub-cycle delay δscT-1 does not substantially change with increasing pump fluence. Red spheres represent the average of δscT-1 over the nine dominant consecutive high-order sideband peaks (compare Fig. 2d) for different pump fluences while the error bars indicate their standard deviation. The black dashed line marks the mean value of the displayed data points.
Extended data Figure 3
Extended data Figure 3. Coherent excitonic polarization dynamics in k-space.
a, Computed high-order sideband intensity IHSG (red shaded area) and driving waveform (blue). Vertical black dotted lines highlight characteristic delay times tex at extrema of IHSG. b-d, Coherent interband polarization |p|2 as a function of time t and reciprocal space coordinate k for distinct delay times tex according to maximum (b, tex = 7 fs; d, tex = 28 fs) and minimum (c, tex = 18 fs) HSG emission (colour-coded, see key). Horizontal white lines mark k = 0. The driving field is depicted as grey curves and the recollision times (compare Fig. 3d) are highlighted by black arrows.
Extended data Figure 4
Extended data Figure 4. Influence of dephasing on high-order sideband generation.
The measured sideband spectrum (shaded area) is compared with computations using constant dephasing times of T2 = 3.2 fs (a, red curve), T2 = 4 fs (b, blue curve) and a momentum-dependent dephasing model as presented in Fig. 1 (a, b, black curves). The sideband orders n are indicated above the relevant peaks. All spectra are normalized to the sideband peak corresponding to n = 2. The inset in panel a depicts the corresponding dephasing times T2(k) as a function of the wave-vector k, while the red (blue) horizontal line indicates a constant decay level T2 = 3.2 fs (T2 = 4 fs).
Extended data Figure 5
Extended data Figure 5. Field scaling of time-resolved high-order sideband generation.
a, Scaling of the modulation depth (comp. discussion in ‘Influence of excitation fluence’ in Methods) of temporal traces of high-order sideband intensity with the driving peak field strength. An increase in the modulation depth hints towards a faster dephasing T2. b, Sub-cycle delay δsc in units of the driving period T averaged over the eight most dominant sideband peaks as a function of the peak field. The error bars represent the standard deviation of the eight peaks and the dashed line depicts a linear fit to the data points.
Extended data Figure 6
Extended data Figure 6. Influence of excitation-induced dephasing.
a, Terahertz waveform used in the computations. b, c, Mean electron excursion 〈k〉 calculated with a constant dephasing T2 = 12 fs (b) and EID (c) for a delay of tex = 7 fs (see vertical dotted lines in a). The shaded areas indicate the intensity envelopes of the excitation pulse with a full width at half maxima of 10 fs (yellow) and 100 fs (gray), respectively. The corresponding mean momenta 〈k〉 are shown as red and black curves, respectively. The red-dashed curves show 〈k〉 after the electron-hole collision. The dashed horizontal lines mark the positions in k-space, where the scattering time T2(k) switches from slow to fast dephasing.
Extended data Figure 7
Extended data Figure 7. High-order harmonic generation in tungsten diselenide.
An intensity spectrum (blue shaded area) of terahertz-driven high-order harmonic generation in 60-nm-thick WSe2 shows distinct peaks at odd orders n’ = 13 to n’ = 47 (indicated by numerals) of the fundamental frequency vTHz = 22.3 THz (peak electric field in air, 21 MV cm-1; ϕ = 90°). An intensity spectrum for φ = 120° is also shown as a black curve. The spectral intensity has been corrected for the grating efficiency as well as the quantum efficiency of the employed spectrograph.
Extended data Figure 8
Extended data Figure 8. Differential sideband spectroscopy.
a, b, Contours of differential spectra ΔI(v, vopt) (see key) as a function of h(vv2SB) and detuning Δopt computed for an excitonic binding energy of EB = 60 meV (a) and EB = 600 meV (b). The black and grey vertical lines mark the positions of the slices shown in (c) and (d), respectively. c, d, Snapshots of ΔI(v, vopt) at fixed values of |h(vv2SB)| = 16 meV below (c) and above (d) the second-order sideband peak for three different binding energies EB = 60 meV (black curve), EB = 240meV (red curve), and EB = 600 meV (blue curve).
Extended data Figure 9
Extended data Figure 9. Quantitative analysis of the binding energy.
a, Measured differential spectra ΔI(v, vopt) for three different detunings Δopt = -75 meV (shaded area), Δopt = -29 meV (black curve), and Δopt = 27 meV (red curve) as a function of v, centered at the position of the second sideband v2SB. b, d, f Computed differential spectra ΔI(v, vopt) for binding energies of EB = 60 meV (b), EB = 240 meV (d), and EB = 600 meV (f) and detunings Δopt as in the experiment shown in panel a. c, e, Colour-coded representation of measured (c) and calculated (e) HSG spectra for Δopt = 0 (intensity scale, see key) as a function of vHSG and delay tex.
Figure 1
Figure 1. High-order sideband generation in tungsten diselenide.
a, Schematic of the experiment in reciprocal space: An interband excitation pulse (red waveform) creates an excitonic polarization in WSe2 (red, vertical arrow), while a strong multi-THz field (blue waveform) simultaneously accelerates the wavepackets of electron and hole (curved arrows) within their respective bands (parabolas). b, Measured intensity spectrum (red) of high-order sidebands from WSe2 (thickness, 60 nm; sample at room temperature) driven by a phase-locked THz transient featuring a centre frequency of 23 THz and external peak field strengths of 17 MV cm-1 (see inset; Keldysh parameter γ = 0.08 < 1) under resonant optical excitation at a frequency of 392 THz (denoted by ‘0’, finite numerals denote the order of sidebands). The black dashed curve shows the calculated intensity spectrum IHSG. c, Recorded high-order sideband intensity IHSG of orders 2 to 8 as a function of driving peak field strength. Dotted lines follow a perturbative scaling law, IHSG Epeak2n), dashed lines mark a linear scaling. d, Measured generation efficiency of the 4th- and 6th-order sideband for different excitation wavelengths (red spheres). Error bars depict the bandwidth (FWHM) of the excitation spectra (excitation spectrum at 392 THz shown as a dashed curve). The shaded area shows the measured exciton resonance in the absorption spectrum of the sample.
Figure 2
Figure 2. Sub-cycle electron-hole recollisions.
a, Spectrally resolved high-order sideband intensity IHSG as a function of delay time tex between the THz driving field (blue curve, compare also panel b) and a 10-fs interband excitation pulse (colour-coded, see key). b, c, Measured (b) and calculated (c) high-order sideband intensity IHSG (red, spectrally integrated between 435 THz and 650 THz) on the same timescale as the driving waveform (blue), which peaks with a global delay δglobal after IHSG. On a sub-cycle scale, the recorded sideband intensity (red) peaks at a distinct time delay δsc after the nearest extrema of the driving waveform (see zoom-in to panel b). d, Sub-cycle delay of IHSG in units of the driving period T for subsequent driving half-cycles at their respective delay times as measured (bright red spheres, error bars: standard deviation of δsc for 25 consecutive measurements) and calculated (dark red spheres). The horizontal black dashed line marks δsc T-1 = 0.
Figure 3
Figure 3. Quantum simulation of sub-cycle electron-hole collisions underlying HSG.
a, b, Schematic Feynman diagrams depicting electron-hole (e-h) pair creation by a near-infrared photon (hvopt) and acceleration by ETHz: Only for ‘good’ excitation times (b), the acceleration leads to a collision and annihilation of the electron-hole pair, thereby emitting a sideband photon hvHSG. c, d, Trajectories (red, the intensity of the line represents the density of coherent excitons) tracing the real-time evolution (time t) of mean electron-hole separation (weighted average of gcoh(r)) for characteristic delays tex corresponding to minimum (c) and maximum HSG emission (d, compare Fig. 2c). Vertical black dotted lines highlight t = 0, which marks the peak of the excitation pulse. While electrons and holes are initially separated, they rapidly recollide (zero excursion marked by the black horizontal lines; time of recollision is highlighted by the black arrow in panel d) upon reversal of the driving field (blue curves), inducing a strong HSG signal (d). For ‘bad’ excitation times, the electron-hole separation increases monotonically, prohibiting recollisions (c). e, f, Occupation fke of the first conduction band as a function of time t and crystal momentum k for delays of tex = -4 fs and 7 fs, respectively (colour-coded, see key). Horizontal white lines mark k = 0. Black solid (dashed) curves trace the weighted average excursion of electrons (holes) in reciprocal space. g, h, Coherent electron-hole correlation function gcoh(r) in dependence on time t and real space coordinate r. Interference patterns occur after the abrupt collapse of coherence caused by e-h recollision (highlighted by the black ellipse in h) which are absent for tex = -4 fs (g). Horizontal white lines mark r = 0.
Figure 4
Figure 4. Experimental comparison of high-order sideband and high-order harmonic generation.
Spectrally resolved high-order sideband intensity IHSG (a, narrow-band exciton preparation at a frequency of 392 THz) and high-order harmonic intensity IHH (b) as a function of the azimuthal orientation (angle φ) of the WSe2 sample (normal incidence; colour-coded, both intensity scales are normalized to the maximum HSG signal, see respective key). While high-order sidebands show virtually no dependence on φ, the high-harmonic spectra reflect the six-fold symmetry of WSe2. Insets: a, Real-space visualization of THz-driven electron-hole recollisions: Upon excitation of a bound electron-hole pair (grey), the carriers (red and blue wavepackets) are accelerated and recollided by the strong light field (blue) to recombine at r = 0, giving rise to high-order sideband emission. b, Schematic of high-order harmonic generation: a polarization between valence and conduction band (grey) is induced by a strong multi-THz field (blue) and simultaneously accelerated within the bands (red and blue spheres, curved red and blue arrow). During this process, the coherent interband polarization is continuously modified (red vertical arrows).

Comment in

Similar articles

Cited by

References

    1. Rutherford E. The scattering of α and β particles by matter and the structure of the atom. Philos Mag Series 6. 1911;21:669–688.
    1. Wyatt T. High-energy colliders and the rise of the standard model. Nature. 2007;448:274–280. - PubMed
    1. Chemla DS, Shah J. Many-body and correlation effects in semiconductors. Nature. 2001;411:549–557. - PubMed
    1. Almand-Hunter AE, et al. Quantum droplets of electrons and holes. Nature. 2014;506:471–475. - PubMed
    1. Basov DN, Averitt RD, van der Marel D, Dressel M, Haule K. Electrodynamics of correlated electron materials. Rev Mod Phys. 2011;83:471–541.

Publication types