. 2016 Sep 16;5(9):969-77.
doi: 10.1021/acssynbio.5b00286. Epub 2016 May 19.

Quorum Sensing Communication Modules for Microbial Consortia

Affiliations

Quorum Sensing Communication Modules for Microbial Consortia

Spencer R Scott et al. ACS Synth Biol. .

Abstract

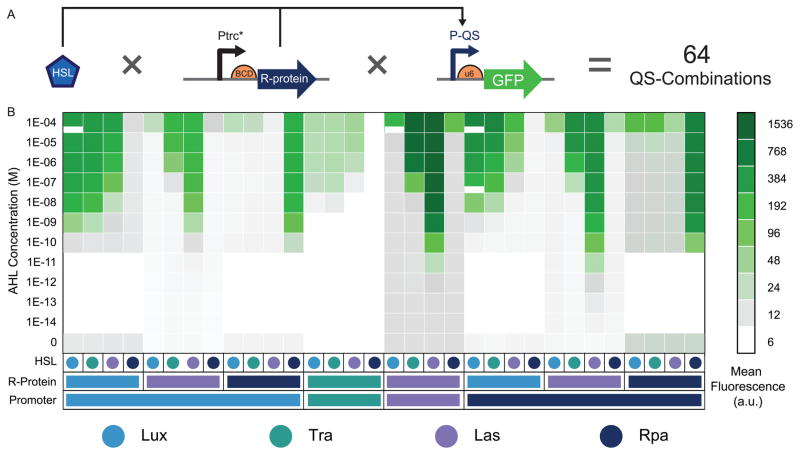
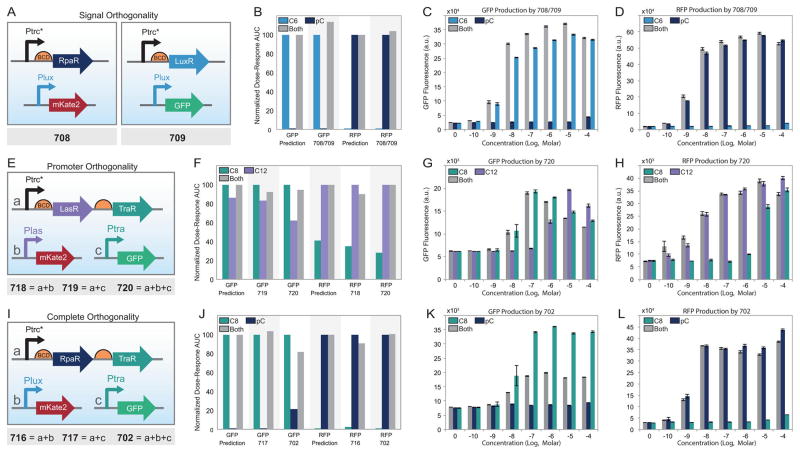
The power of a single engineered organism is limited by its capacity for genetic modification. To circumvent the constraints of any singular microbe, a new frontier in synthetic biology is emerging: synthetic ecology, or the engineering of microbial consortia. Here we develop communication systems for such consortia in an effort to allow for complex social behavior across different members of a community. We posit that such communities will outpace monocultures in their ability to perform complicated tasks if communication among and between members of the community is well regulated. Quorum sensing was identified as the most promising candidate for precise control of engineered microbial ecosystems, due to its large diversity and established utility in synthetic biology. Through promoter and protein modification, we engineered two quorum sensing systems (rpa and tra) to add to the extensively used lux and las systems. By testing the cross-talk between all systems, we thoroughly characterized many new inducible systems for versatile control of engineered communities. Furthermore, we've identified several system pairs that exhibit useful types of orthogonality. Most notably, the tra and rpa systems were shown to have neither signal crosstalk nor promoter crosstalk for each other, making them completely orthogonal in operation. Overall, by characterizing the interactions between all four systems and their components, these circuits should lend themselves to higher-level genetic circuitry for use in microbial consortia.

Keywords: crosstalk; microbial consortia; orthogonal; quorum sensing; synthetic ecology.


Conflict of interest statement

Notes

The authors declare no competing financial interest.

Figures

Figure 1
Figure 1
Potential sources of crosstalk between quorum sensing systems. Top left: R-protein (LuxR) binds its cognate ligand (3OC6HSL) to become active and drive transcription from the Plux promoter. Top right: Signal crosstalk occurs when the R-protein can become active through binding of an HSL other than its cognate ligand, such as LuxR binding 3OC12HSL, common to the las system. Bottom left: Promoter crosstalk occurs when the QS promoter of one system can be activated by the active R-protein of another system, such as Plux being activated by LasR bound to 3OC12HSL. Bottom right: Mixtures of both signal and promoter crosstalk can occur, allowing an R-protein from one system to bind an off-target ligand and activate a noncanonical promoter.
Figure 2
Figure 2
Engineering new QS systems in E. coli (A) Mean fluorescence of GFP-LuxR-like protein fusions. Positive control is constitutively expressed GFP, and negative control is the E. coli strain with no GFP plasmid. (B) Wild-type rpa-promoter is nonfunctional in E. coli, however an engineered Plux-rpa promtoer functions well. (C) Wild type tra-promoter is also nonfunctional, but an engineered Plux-tra promoter shows significant fold-change in the presence of cognate ligand. Also, an engineered TraR with a point mutation to increase sigma factor binding increases fold change of the tra system. (B), (C) Mean values are normalized by lowest expression in each panel. Error bars represent SEM (n = 3).
Figure 3
Figure 3
Dose–response from multiplexed quorum sensing circuits: (A) Genetic schematic of a single construct in the presence of a particular HSL ligand. With four R-proteins and four promoters there are 16 two-plasmid combinations each induced with four different HSLs giving 64 promoter/R-protein/HSL combinations measured at 8 ligand concentrations (or 12 for LasR). (B) Heat map showing GFP abundance for all QS combinations and HSL concentrations. Each column denotes a unique combination of signal (HSL), receptor (R-protein), and reporter (QS promoter), with rows denoting the concentration of ligand. Only Promoter/R-protein combinations that resulted in at least a 2-fold increase for one or more HSL are shown (full data via Figure S3 and Supplementary Data 1). Each value corresponds to the mean fluorescence value measured from a cell population normalized by the population’s cell-density; all combinations and concentrations were done in triplicate.
Figure 4
Figure 4
Activity area of dose–response curve as performance standard. (A) The maximum fold-change of a diverse subset of the QS constructs after 3 h of induction. (B) Normalized dose–response curves of a subset of QS constructs that demonstrate a variety of EC50s. Each curve is normalized by its own maximum value, such that each curve converges to 1. (C) Fitted dose–response curves to the experimental data and their calculated activity areas. The red dot indicates the mean expression in the absence of HSL. Gray box under the curve represents the inherent leakiness of the circuit. Where the dotted lines meet the x-axis gives the EC50 value. Error bars indicate the standard error of the mean (n = 3).
Figure 5
Figure 5
Identifying crosstalk and orthogonality between QS circuits. (A) Activity area of the fitted curve, across all HSL concentration values, is used to graphically represent every R-protein’s affinity for each HSL ligand and each QS-promoter’s ability to be activated by an off-target receptor. Left column: Signal crosstalk as demonstrated by each canonical promoter/R- protein pair’s ability to be activated by nonspecific ligands. In each box, values are normalized by the maximum performance of that R-protein/Promoter pair (e.g., LLT/LLL = 96%). Right column: Activation of each promoter by each canonical R-protein/ligand pair, representing promoter crosstalk. In each box, values are normalized by the maximum performance of that promoter (e.g., LRR/LLL = 87%). (B–E) Comparisons of two sets of QS systems and all possible cross-interactions. Activity area of each column’s fitted curve is normalized by the maximum activity area of the promoter corresponding to that particular column (e.g., LLA/LLL or AAL/AAA). (B) The lux system demonstrates both signal and promoter crosstalk to the las system, while the las is orthogonal to the lux system. (C) The lux and rpa systems are signal orthogonal but demonstrate two-way promoter crosstalk. (D) The las and tra systems are promoter orthogonal but demonstrate two-way signal crosstalk. (E) The rpa and tra systems are completely orthogonal.
Figure 6
Figure 6
Verification of QS component orthogonality. (A) Genetic schematic of signal orthogonal strains 708 and 709. (B) A 1:1 coculture of 708 and 709 was subjected to the full range of HSLs, and the AUC of the dose–response was compared to predictions based on their original characterization in Figure 3 and Table S1. For all predictions, it was assumed the canonical HSL would give the maximum response, so it was assumed providing both HSLs would still give an AUC of 100. Each experiment is normalized by the canonical response, such that the AUC of the GFP dose–response to C6-HSL is set to 100, making the ratio between columns in a set the point of comparison. For example, the 708/709 GFP column set follows this formula: (AUC-C6/AUC- C6), (AUC-pC/AUC-C6), (AUC-Both/AUC-C6). (C, D) Raw fluorescence expression of the 708/709 coculture. Error bars represent SEM (n = 4). (E) Genetic schematic of promoter orthogonal strains 718, 719, and 720. (F) Normalized dose–response AUC showing similarity between predictions and in vivo results. (G, H) Raw fluorescence expression of 720. Raw expression of 718 and 719 is available in Figure S5. (I) Genetic schematic of complete orthogonal strains 716, 717, and 702. (J) Normalized dose–response AUC of predictions and in vivo results. (K, L) Raw fluorescence expression of 702. Raw expression of 716 and 717 is available in Figure S5. Error bars represent SEM (n = 4).

References

    1. Khalil AS, Collins JJ. Synthetic biology: applications come of age. Nat Rev Genet. 2010;11:367–379. - PMC - PubMed
    1. Ro DK, Paradise EM, Ouellet M, Fisher KJ, Newman KL, Ndungu JM, Ho KA, Eachus RA, Ham TS, Kirby J, Keasling JD. Production of the antimalarial drug precursor artemisinic acid in engineered yeast. Nature. 2006;440:940–943. - PubMed
    1. McDaniel R, Weiss R. Advances in synthetic biology: on the path from prototypes to applications. Curr Opin Biotechnol. 2005;16:476–483. - PubMed
    1. Dueber JE, Wu GC, Malmirchegini GR, Moon TS, Petzold CJ, Ullal AV, Prather KL, Keasling JD. Synthetic protein scaffolds provide modular control over metabolic flux. Nat Biotechnol. 2009;27:753–759. - PubMed
    1. Kizer L, Pitera DJ, Pfleger BF, Keasling JD. Application of functional genomics to pathway optimization for increased isoprenoid production. Applied and environmental microbiology. 2008;74:3229–3241. - PMC - PubMed

Publication types

MeSH terms